


Feedback
Metrics Overview
This dashboard provides a centralized view of telemetry metrics gathered from all monitored components in the Relativity environment. It highlights metric volume, source distribution, and time-based trends, enabling administrators to validate monitoring coverage, detect anomalies, and ensure that critical performance data is consistently captured.
Metric Distribution by Source and Framework
It displays metric counts grouped by telemetry source and framework. The pie chart highlights which agents and frameworks contribute the most metrics, while the bar chart shows the top metric-producing namespaces.
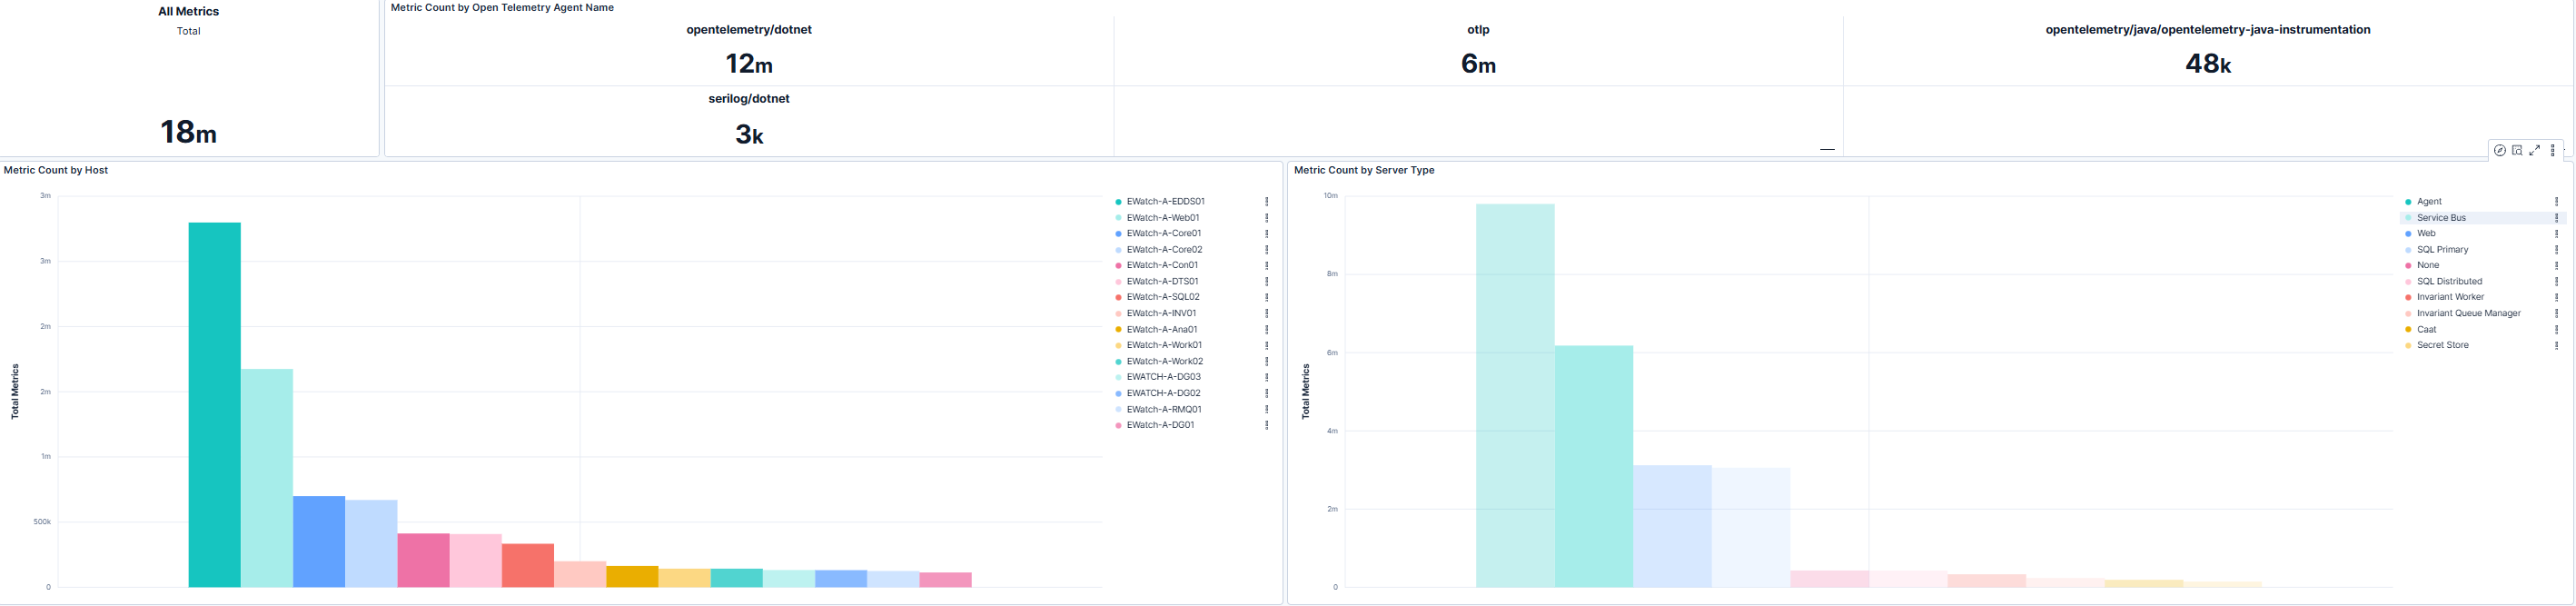
Metric Volume by Host and Server Type
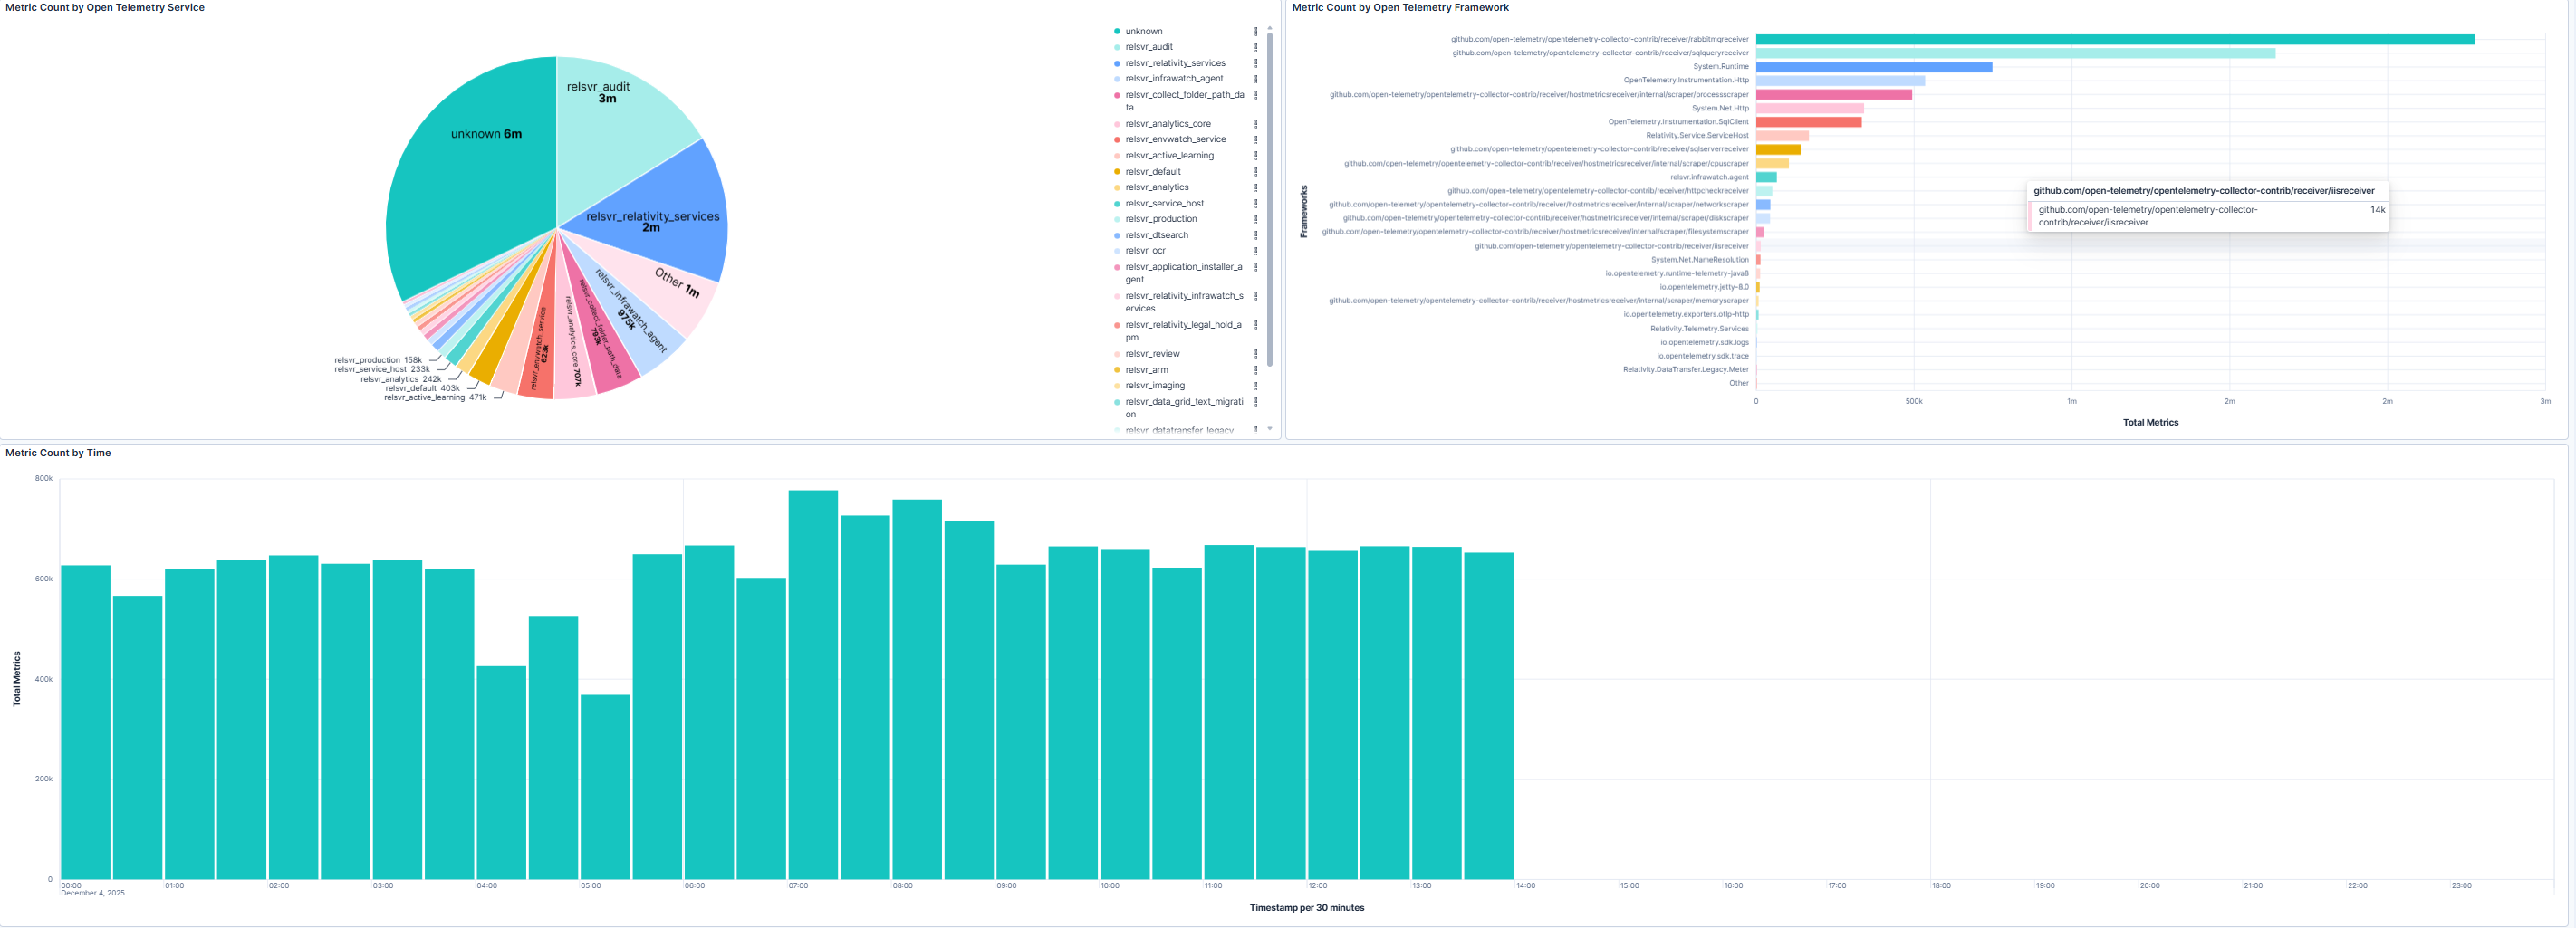
This section provides a detailed breakdown of metric counts by host and server type, along with a time-based trend chart. Relativity administrators can use this view to confirm consistent metric collection across all monitored systems and detect gaps or anomalies. Spikes or drops in the trend chart may indicate monitoring agent issues, configuration errors, or system instability requiring attention.
Use Cases
| Use Case | Description |
|---|---|
| Validate metric collection | Confirm that metrics are consistently gathered across all hosts and services. |
| Detect anomalies | Identify sudden changes in metric volume that may signal resource or monitoring issues. |
| Analyze telemetry sources | Understand which frameworks and agents produce the most metrics for optimization. |
| Support performance analysis | Use time-based trends to correlate metric patterns with workload changes or system events. |