


Feedback
Logs Overview
This dashboard provides a centralized view of log activity collected from all monitored components in the Relativity environment. It highlights log volume, severity levels, and source distribution, enabling relativity administrators to quickly identify anomalies, error trends, and potential system issues.
Log Volume and Severity Summary
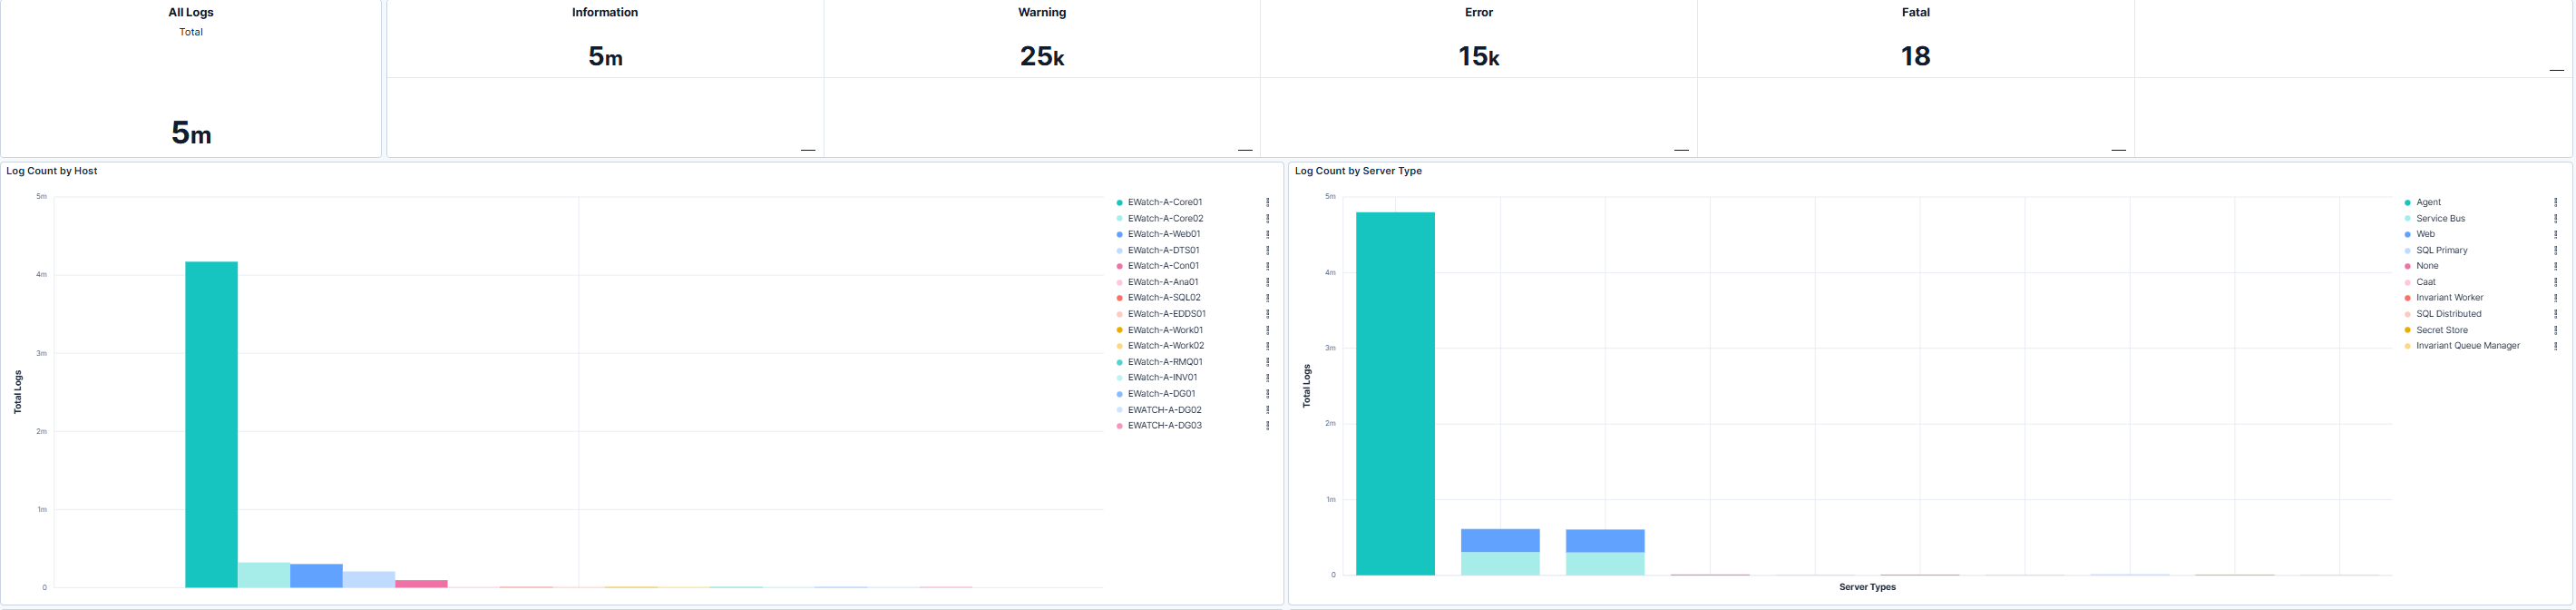
This section displays total log counts along with severity-level breakdowns, including informational, warning, error, and fatal events. These metric indicators help relativity administrators assess overall system health and prioritize investigation of critical issues. The accompanying charts show log distribution by host and by server type, making it easier to identify which systems generate the most logs and whether specific server roles exhibit abnormal patterns.
Log Source Patterns and Trends
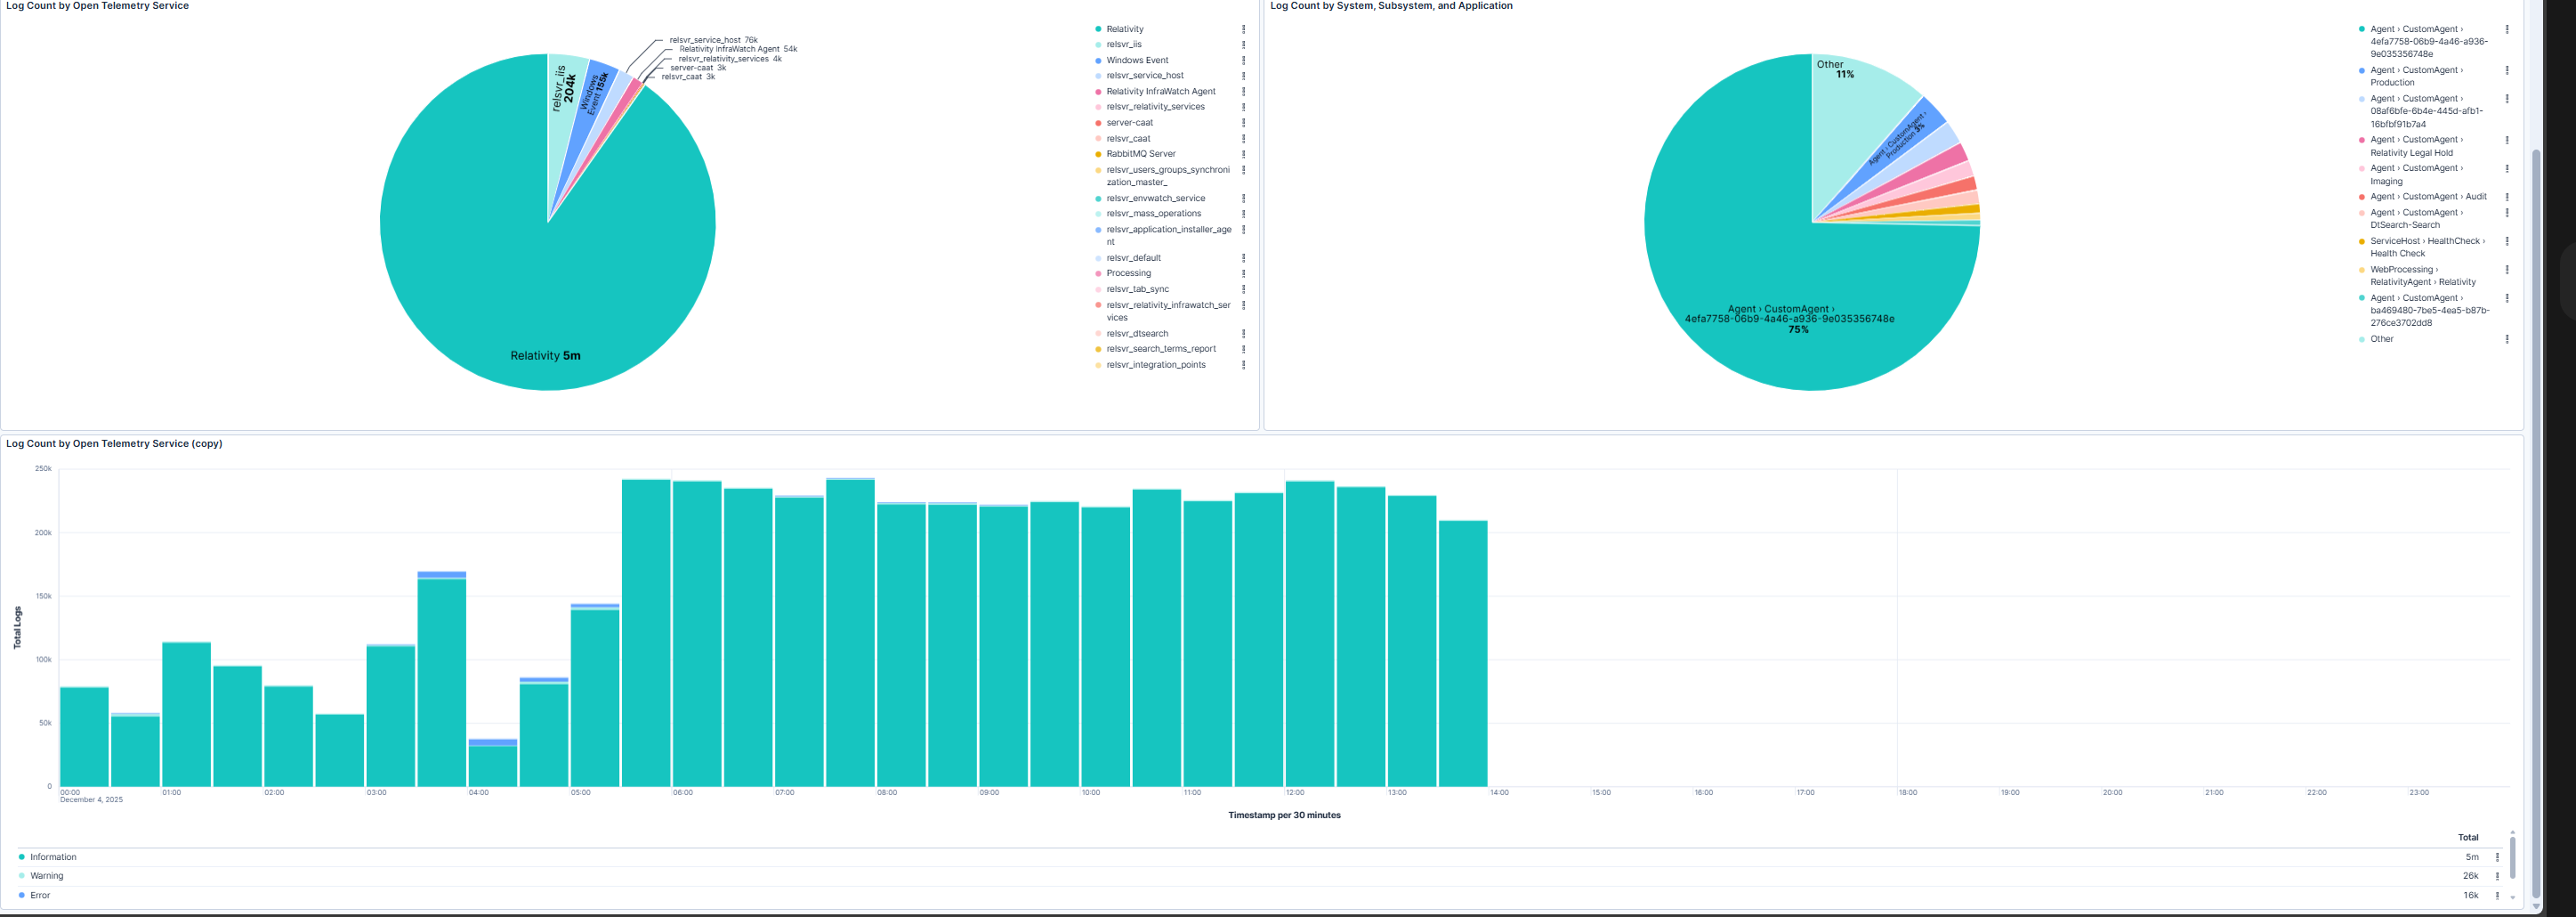
This section provides insights into log sources by telemetry service and application, along with time-based trends for log generation. The pie charts highlight which services and applications contribute the most logs, supporting targeted troubleshooting and resource optimization. The trend chart enables relativity administrators to detect spikes or sustained increases in log activity that may indicate underlying issues requiring attention.
Use Cases
| Use Case | Description |
|---|---|
| Monitor log volume | Track overall log counts and severity levels to maintain visibility into system health. |
| Identify error patterns | Detect hosts or server types generating excessive warnings or errors for targeted remediation. |
| Analyze log sources | Understand which services and applications produce the most logs to optimize monitoring and troubleshooting. |
| Detect anomalies | Use time-based trends to spot unusual spikes in log activity that may signal system instability. |