


Feedback
IIS Overview
This dashboard provides real-time visibility into the health and performance of IIS (Internet Information Services) web servers within your Relativity environment. This dashboard helps to quickly verify that all web servers and sites are operational, that there are no active HTTP request errors, and that system resource utilization remains within normal ranges. By consolidating key IIS metrics such as response time, connection count, and CPU/memory utilization, this dashboard supports proactive monitoring and performance optimization for Relativity web components.
IIS Health and Resource Overview
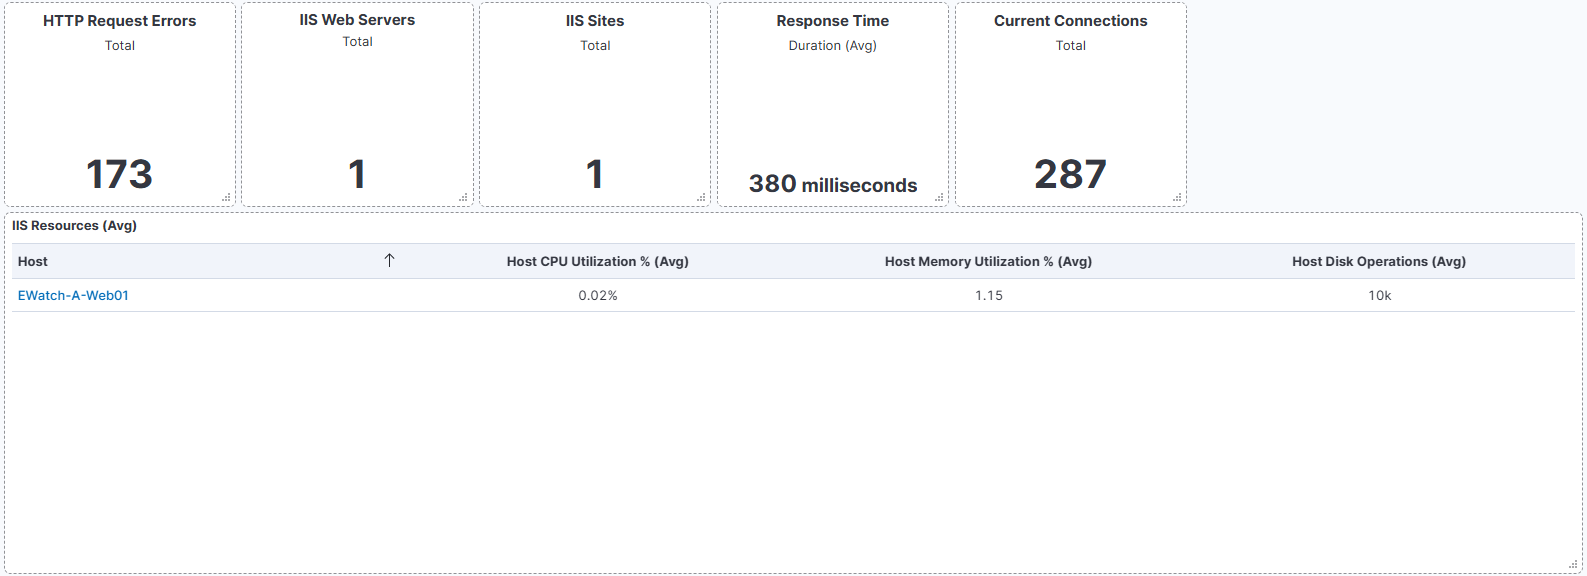
This screenshot shows the IIS Overview dashboard, displaying both service health indicators and system utilization metrics for web servers.
The top section highlights key performance statistics, including total web servers, total sites, average response time, and current connections. The HTTP Request Errors health indicates whether the IIS environment is operating normally — a "Healthy" status confirms no errors were recorded during the monitored period.
The lower section provides host-level resource data such as average CPU and memory utilization, as well as disk operation metrics. These indicators help in assessing server load and identify potential performance issues across IIS nodes.
Use Cases
| Use Case | Description |
|---|---|
| Monitor web server health | Confirm that all IIS web servers and hosted sites are functioning correctly. A healthy status with zero request errors ensures HTTP requests are processed without failure. |
| Troubleshoot performance issues | Use response time and connection metrics to identify slow site responses or unexpected server load. Review CPU and memory utilization to diagnose resource bottlenecks. |
| Plan capacity and optimize resources | Track CPU, memory, and disk activity trends to enable proactive scaling and ensure sufficient capacity for future workload demands. |