


Feedback
IIS Errors
This dashboard provides visibility into HTTP errors generated by IIS across your Relativity environment. It helps users to detect, categorize, and troubleshoot both client-side (4xx) and server-side (5xx) HTTP errors that may affect user experience or system stability. It serves as a key resource for identifying issues in the web tier, ensuring that Relativity web servers are handling requests as expected. Users can drill into two linked sub-dashboards for deeper investigation:
- IIS 400 Errors - Displays client-side HTTP errors (e.g., 400, 401, 403, 404).
- IIS 500 Errors - Displays server-side HTTP errors (e.g., 500, 503).
IIS 400 Errors (Client-Side)
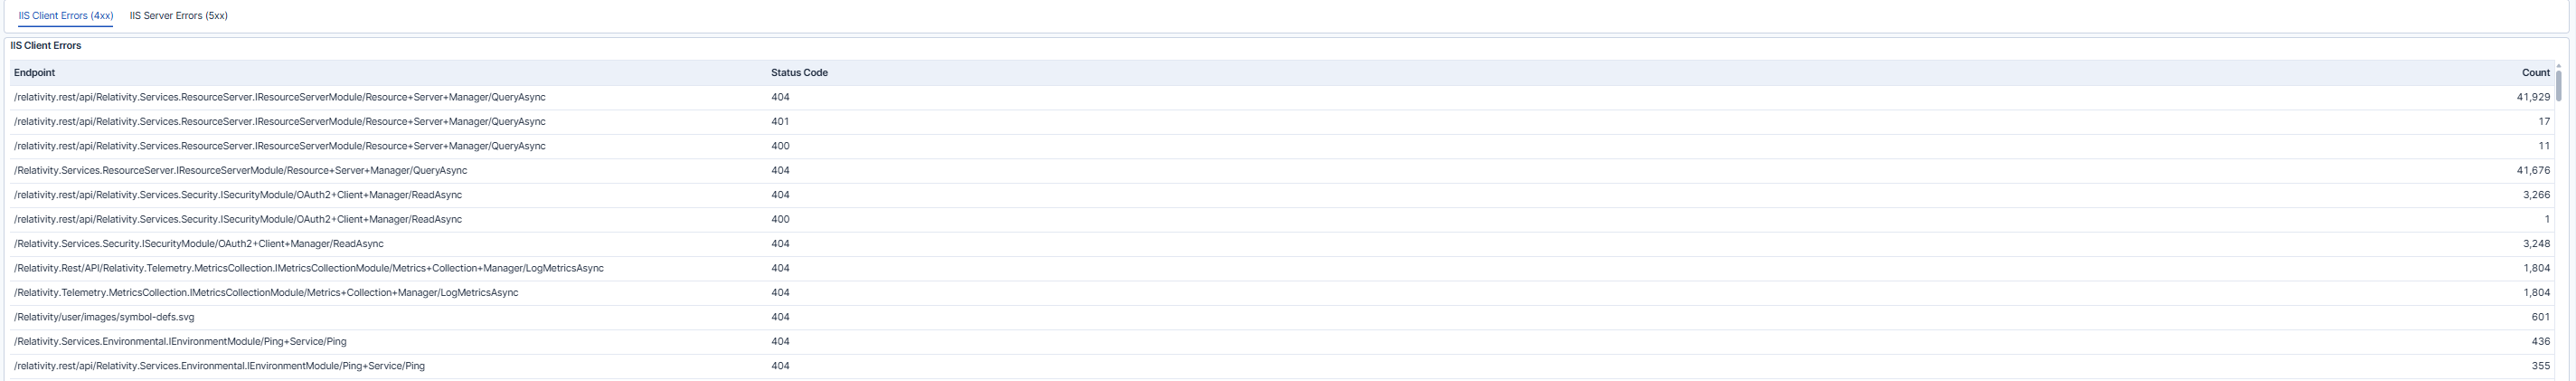
The IIS 400 Errors dashboard lists all client-side HTTP requests that resulted in 4xx status codes, such as 404 Not Found or 403 Forbidden. These errors typically indicate issues originating from the client side for example broken links, incorrect URLs, or unauthorized access attempts. The dashboard includes key fields such as Endpoint, Status Code, and Count, allowing users to quickly identify which endpoints are most frequently returning client-side errors. Monitoring these metrics helps detect application misconfigurations or user-access issues that could affect Relativity workspace functionality.
IIS 500 Errors (Server-Side)
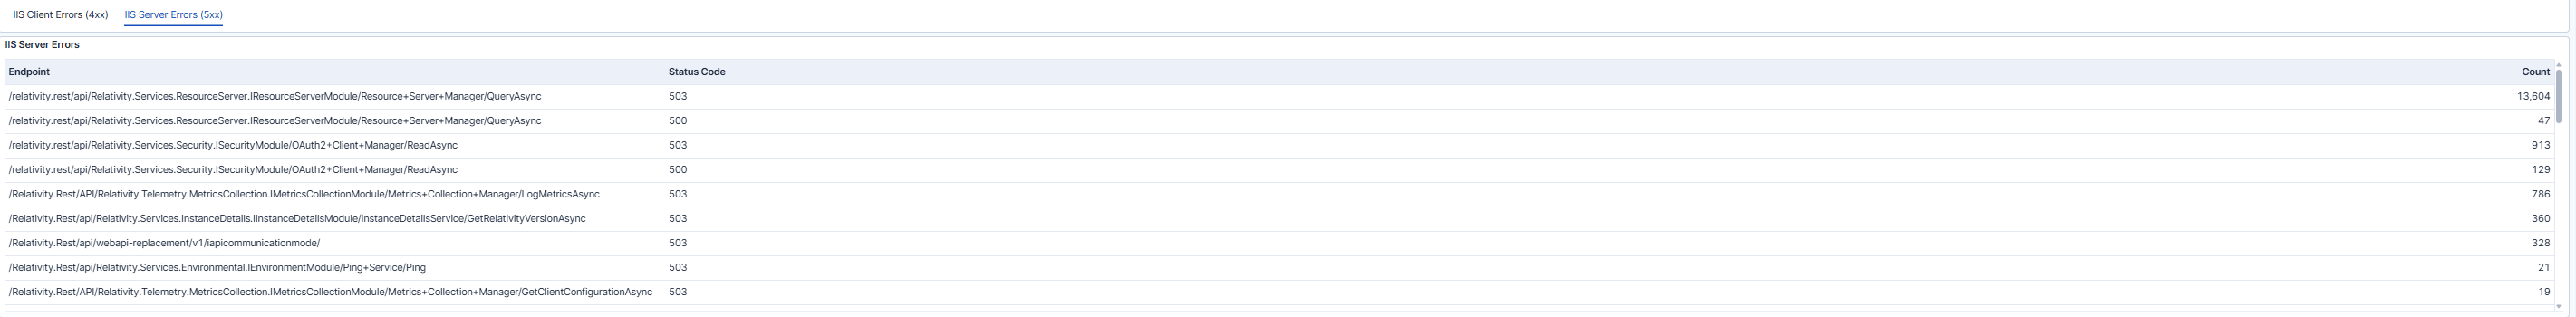
The IIS 500 Errors dashboard focuses on server-side HTTP failures such as 500 Internal Server Error or 503 Service Unavailable. These errors generally occur when IIS or an underlying Relativity service encounters an exception or resource issue while processing a request. This dashboard displays similar columns for Endpoint, Status Code, and Count, helping users to identify recurring problem areas. A high frequency of 500-series errors may indicate service instability, configuration conflicts, or resource constraints requiring deeper investigation. Reviewing the affected endpoints and their associated error counts helps isolate which Relativity modules or services are generating exceptions, supporting faster remediation.
Use Cases
| Use Case | Description |
|---|---|
| Troubleshoot failed requests | Pinpoint specific endpoints or services where requests consistently fail, enabling faster root-cause analysis and reducing downtime. |
| Monitor application health | Review 4xx and 5xx errors regularly to gain early insight into potential configuration issues, permission problems, or backend service failures. |
| Track stability and improvements | Monitor error counts and trends over time to measure the impact of configuration changes or application updates, ensuring system reliability improves with each release. |