


Feedback
Document Review Performance
This dashboard provides an in-depth look at document loading behavior and viewer responsiveness across the Relativity Review Interface. It helps users track metrics related to document load times, viewer success rates, and navigation performance to ensure users experience smooth and consistent review sessions. It helps identify latency issues, slow viewer responses, or failed document loads before they impact reviewers. Using this dashboard, teams can proactively maintain optimal performance across all active workspaces and document types.
Review Load and Document Insights
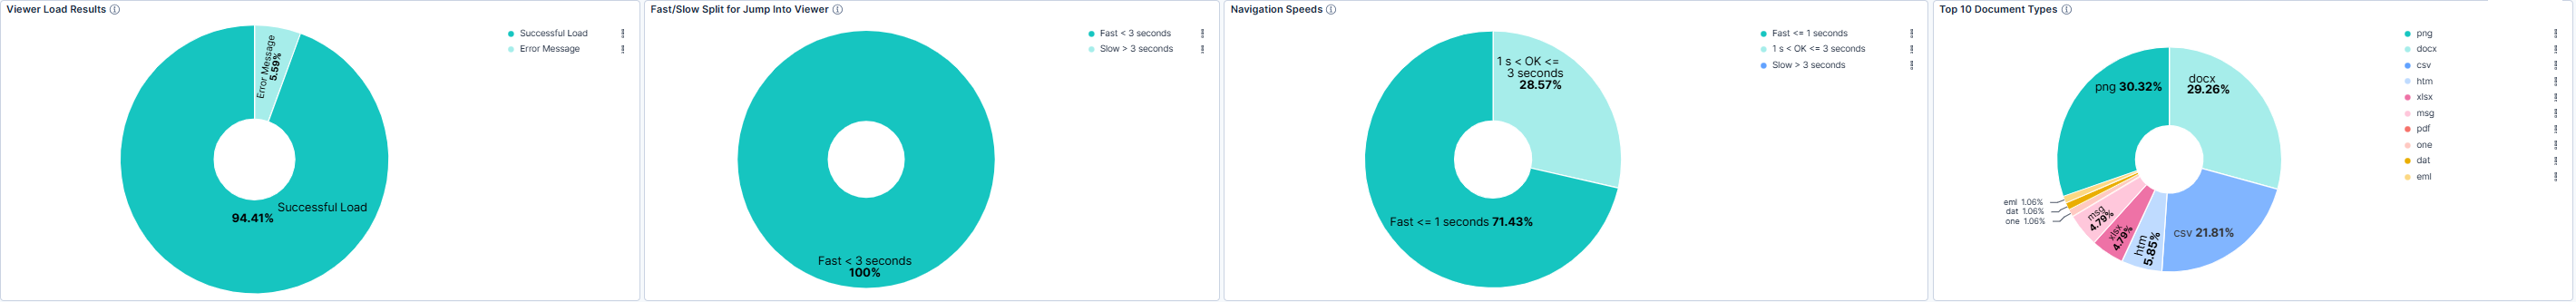
The Review Load and Document Insights section highlights high-level performance indicators for document loads, including viewer load success rate, jump-to-viewer latency, and document type distribution. Health indicator provide immediate visibility into whether document loads and response times are within expected limits. The charts illustrate trends in successful loads versus failures and show which document types (such as MSG, XLS, or PDF) dominate review activity. It helps users identify potential content or document-specific issues that may contribute to slowdowns or load failures.
Viewer Navigation and Load Speed Trends
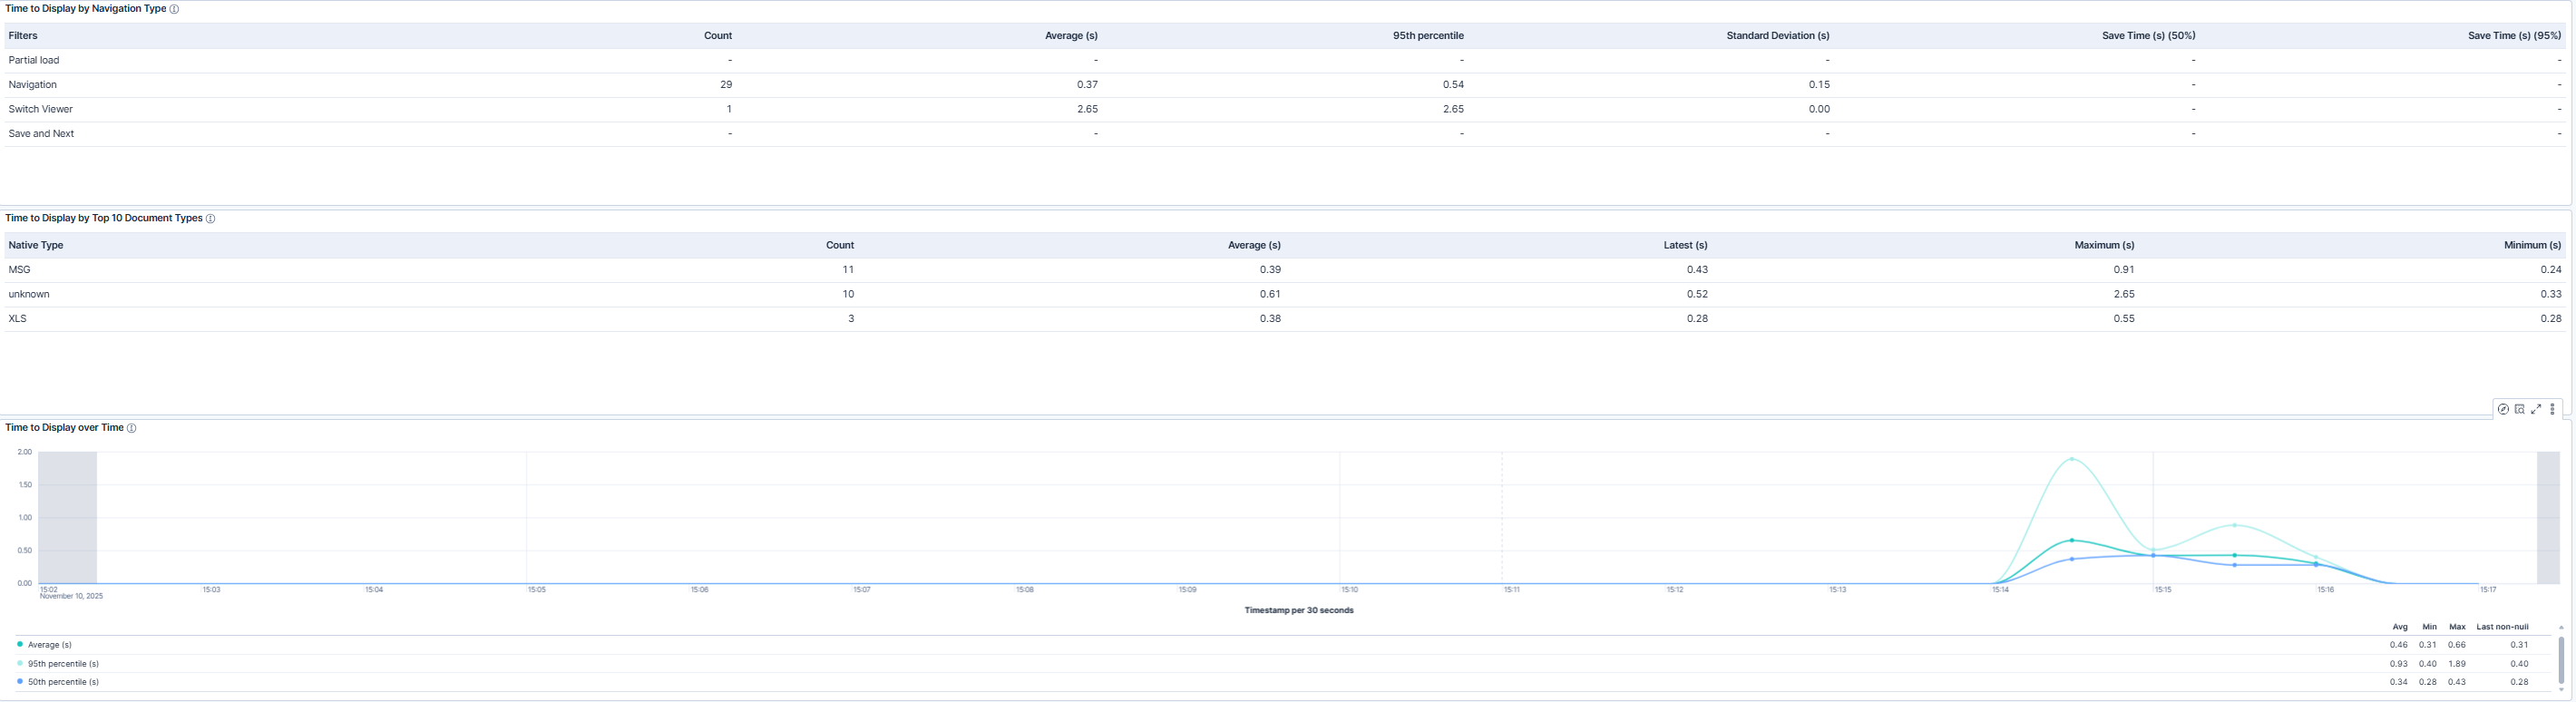
The Viewer Navigation and Load Speed Trends section tracks how quickly users can open, view, and switch between documents. Metrics such as average time to display, navigation latency, and response percentiles help measure user experience and highlight areas where load times may be slower than expected. Teams can analyze performance by navigation type (such as switching viewer modes or navigating through document sets) and document type to determine whether specific file types or actions are causing delays. These insights enable proactive adjustments to configuration, caching, or infrastructure resources to maintain fast and consistent document navigation speeds.
Navigation Activity Over Time
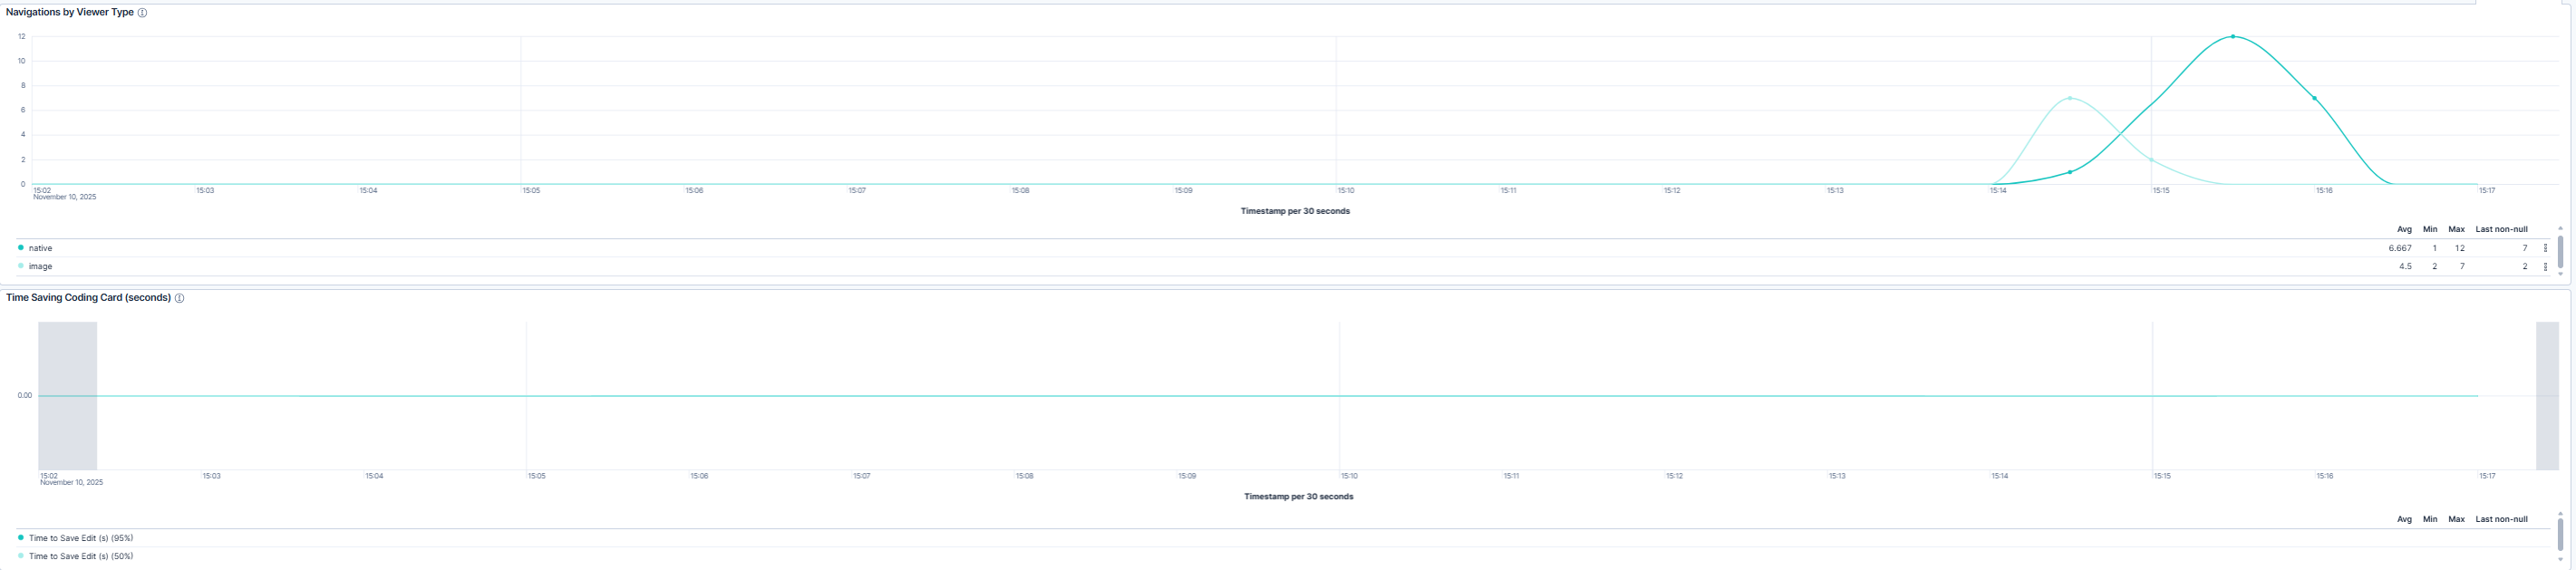
The Navigation Activity Over Time section visualizes how user activity and viewer performance change throughout the selected time window. Trends for time to display, viewer navigations, and time-saving actions (such as coding card saves) allow administrators to monitor performance fluctuations and ensure stability during high-demand review periods.
These charts also help correlate spikes in latency with specific time frames, workloads, or reviewer behaviors, supporting rapid diagnosis of performance degradation.
Use Cases
| Use Case | Description |
|---|---|
| Monitor document load performance | Confirm that documents load successfully and perform within expected response times across all workspaces and viewer types. |
| Troubleshoot viewer latency issues | Use load time and response trend metrics to identify causes of slow navigation or document loading, such as network conditions, or document size and type. |
| Ensure consistent reviewer experience | Monitor user activity, document load times, and navigation speeds to confirm stable performance across workspaces, times of day, and review sessions. |