Feedback
Environment Watch Overview
Environment Watch is a turnkey monitoring solution that provides Relativity Server customers with enhanced insights into the state of their environment.
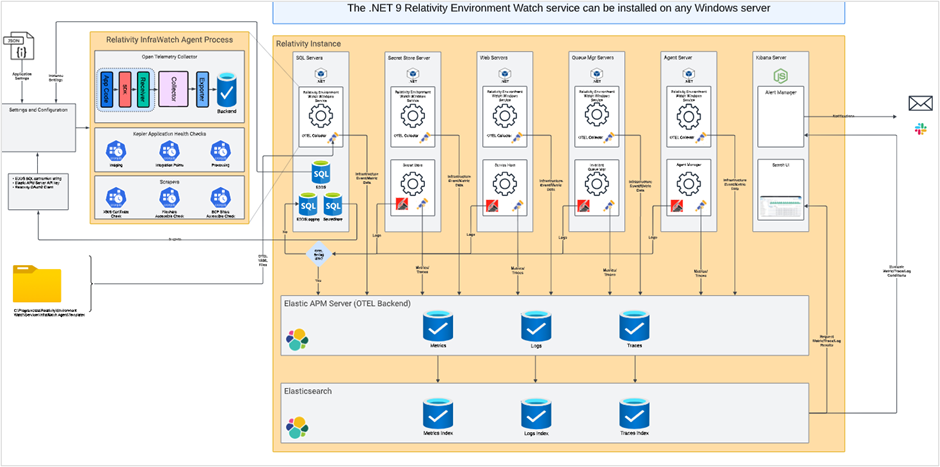
To enable Environment Watch, Relativity has instrumented a large surface area of the Server platform and infrastructure with Open Telemetry to enable standardized collection and structuring of telemetry data (metrics, logs, and traces). These telemetry data are stored in an Elasticsearch cluster configured within your environment (none of the telemetry data is transmitted back to Relativity). Additional Elastic components are also utilized for alerts, dashboards, and searching (Kibana) and telemetry data collection (APM Server).
Environment Watch offers the following out-of-the-box capabilities and benefits:
- Alerts that indicate an active or potential issue in your environment. These alerts cover service and application health, host metrics (CPU/disk/RAM), file share/SQL connectivity, RabbitMQ health, agent processes, billing data transmission issues, and much more.
- Dashboards to explore and help investigate issues related to system health and activity.
- New in-app alerts experience - In addition to the alerts and dashboards built on and accessible via Kibana UI, an integration with Relativity provides real-time alerting within Relativity. When deployed, this replaces the existing Alerts on the Instance Details page, which are now referred to as "legacy Alerts". It includes all existing alerts, adds new ones, and enhances the notification and handling experience.
- Log searching - Logs for Relativity, Invariant, Windows, and more to come (e.g. RabbitMQ, CAAT) logs are easily accessible, searchable, and exportable via Kibana.
- Metrics stored in a common structure and accessible programmatically - All metrics captured by Environment Watch are stored in a common Open Telemetry based structured and accessible via the Elasticsearch APIs.
Telemetry System Architecture and Data
Environment Watch is a sophisticated monitoring system designed to track and analyze environmental data in real-time. The system is built to be scalable, reliable, and efficient, ensuring that it can handle large volumes of data and provide accurate insights.
Observability
Observability is the ability to understand the internal state of a system by examining its outputs. In the context of software, this means being able to understand the internal state of a system by examining its telemetry data, which includes traces, metrics, and logs.
To make a system observable, it must be instrumented. That is, the code must emit traces, metrics, or logs. The instrumented data must then be sent to an observability backend.
Metrics
This instrument is used to show quantitative data points that measure various aspects of system performance.Examples include:
- CPU usage
- Memory consumption
- Free disk space
Traces
This instrument is used to show the flow of requests through the system, helping to identify performance bottlenecks and understand interactions between different services. Examples include:
- HTTP request
- ETL service that transforms and imports data
- Worker service that converts documents
Logs
This instrument is used to show detailed records of events that occur within the system, capturing information such as error messages and user activities. Examples include:
- Information logs that describe input parameters and successfully flow or completion of a critical section of code
- Warning logs that describe potential issues while executing a request or job
- Error logs that describe unexpected issues while executing a request or job
Open Telemetry
Open Telemetry is an open source solution that defines industry standard APIs/SDKs/Tools to instrument virtually any software to help analyze performance and behavior. It was developed by the Cloud Native Computing Foundation, the same outfit that developed Kubernetes/Prometheus.
Relativity Server selected Open Telemetry for three key reasons:
- No vendor lock-in; single set of APIs and conventions
- Proven industry standard for observability
- Highly scalable framework
The Open Telemetry architecture is composed of the following key components:
- Open Telemetry backend
- Open Telemetry collector
- Visualization frontend
- Alert Management
Open Telemetry Backend
Open Telemetry requires a backend that can handle large amounts of data coming from many different sources. The backend makes it possible to analyze, visualize, and set up alerts on this data in real time. To ensure compatability, it must natively support Open Telemetry via Open Telemetry Line protocol (OTLP).
Open Telemetry Collector
The Open Telemetry Collector is a lightweight service that runs on each monitored server. It gathers metrics, logs, and traces, then forwards them to the backend. Relativity Server automatically configures the Collector, making it easy to collect both infrastructure and Relativity-specific data, including:
- Host metrics (e.g. CPU/Memory/Disk/Network/Process)
- IIS/SQL Server
- Windows services (e.g. Agent/Web Manager/Invariant/Service Host)
- Kepler service endpoints and Relativity/BCP fileshares
- X509 certificates
The Open Telemetry SDK is used to submit metrics to the Open Telemetry collector from different Relativity processes including:
- Environment Watch Monitoring Agent
- Service Host
- Kepler services
- Custom Pages
- Invariant Queue Manager/Worker
Visualization Frontend
In a highly distributed environment, millions of JSON records are generated each day. With so much unstructured data, the frontend solution must provide a way to monitor, search, and analyze the metrics.
Alert Management
Given the large amount of metrics/traces/logs, alerts define rules to detect both simple and complex conditions that trigger actions when those conditions have been met. Examples include:
- CPU exceeds threshold
- Insufficient disk space
- Expired X509 certificate
Environment Watch and the Elastic Stack
Starting with Server 2024, the Environment Watch architecture relies on the Elastic stack to support Open Telemetry. Elasticsearch delivers the backend performance required to manage high volume of metrics, Kibana for both frontend and alert management, and Elastic APM Server ingests metrics from the Open Telemetry collectors deployed within each server. With Environment Watch installed, Relativity logs are no longer written to the EDDSLogging database. Instead, new log entries are sent to Elasticsearch and can be viewed in Kibana.
High-Level Architecture
Ensure inbound/outbound ports are open for this Elastic stack component.
See the port diagram for network requirements.
Relativity Environment Watch Windows Service
The Open Telemetry Collector provides many "out of the box" receivers to collect metrics; however each server must be carefully configured using one or more YAML files, depending on which "receivers" are required. In some cases, credentials must be exposed to the receivers in order to fetch metrics. Although the Open Telemetry distribution provides many commonly used receivers, there are many Relativity specific use-cases that Open Telemetry simply doesn't support. In these cases, an alternative mechanism is required use both Relativity and non-Relativity APIs to gather metrics and use the Open Telemetry SDK to publish the results.
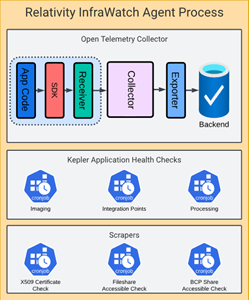
The Relativity Environment Watch Windows Service is responsible for scheduling supported processes that perform different tasks. The Relativity InfraWatch Agent is arguably the most important process scheduled by the Environment Watch architecture as it provides the following key responsibilities:
- Autoconfigures the Open Telemetry collector
- Infrastructure/Relativity secrets exposed to the Open Telemetry collector via process environment variables
- Manages the Open Telemetry collector process
- Supports custom "scrapers" to publish metrics via Open Telemetry SDK using Windows/Relativity APIs
- Generates a bearer token for use by Kepler-based endpoints w/ expiration support
Microsoft Installer (MSI) technology provides Relativity administrators a solution to perform both unattended and attended initial setup and upgrades. The Relativity Environment Watch Windows service and all underlying processes are built on a completely new .NET 9 platform and operates independent of Relativity. This represents a crucial architectural feature because it guarantees the monitoring solution will always function. If there's a problem within Relativity, this will never prevent the solution from obtaining metrics. Likewise, the alert architecture is sophisticated enough to fail when it doesn't receive metrics from each registered server.
The appsettings.json file located within the Relativity Environment Watch installation directory can also be used to customize the Open Telemetry collector and tweak the custom scrapers.
Relativity Platform
The Relativity platform has been updated to expose low-level details using the Open Telemetry SDK from any extensibility point. Key platform enhancements include:
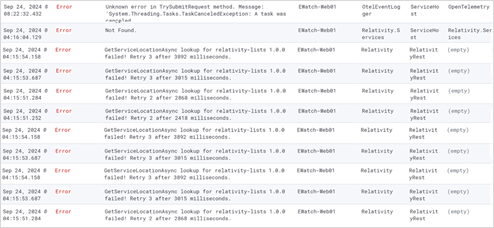
- Relativity Logging: the existing Relativity.Logging.ILog API sends all logs to the Open Telemetry backend.
- Logging Behavior with Environment Watch: When Environment Watch is enabled, all new log entries generated by Relativity are routed to Elasticsearch and surfaced in Kibana. Existing log data is not migrated. Only logs created after installation are available within Kibana.
- Relativity Agents: a trace is created for each agent execution
- Kepler Services: a trace is created for each HTTP request
- Service Host: health checks are periodically executed to ensure hosted services are working correctly
- Invariant: a trace is created for each operational Invariant Queue Manager/Worker
Kibana Alert Manager
Once each Relativity server has been setup with an InfraWatch Agent, metrics/traces/logs are continually exported to the Elastic APM Server (e.g. Open Telemetry backend) where the data is persisted to Elasticsearch indexes. Although Kibana is often considered the front-end for Elasticsearch, it also supports the Kibana Task Manager feature to allocate resources to monitor alerts.
As the metrics are continually submitted to the Open Telemetry backend, Kibana evaluates the conditions to determine whether the alert is active or not. Depending on the Elasticsearch license, each alert can be configured to notify via Slack, Email, or WebHook.
Elastic Index Lifecycle Management
By default, Elasticsearch sets up Index Lifecycle Management (ILM) Policies
- Logs: 10 days
- Metrics: 90 days
- Traces: 10 days
These defaults can be customized in Elasticsearch to meet your organization's data retention requirements.
Relativity Alerts
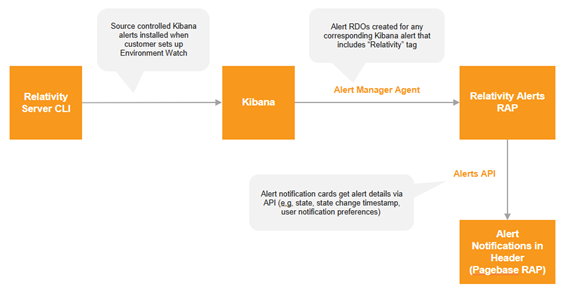
Although alerts can be viewed within Kibana, Environment Watch uses a new Relativity Alerts application to integrate the alerts directly within the main Relativity UI. A new Alert Manager agent periodically uses a Kibana REST API to fetch alert details and update the "bell" header with the number of active alerts. Additional details about the Relativity Alerts application are provided below.
Relativity Alerts reflect the state of Kibana alerts within the Relativity UI. A Relativity agent periodically synchronizes the RDOs with the corresponding Kibana alerts, updating their state and trigger information.
- Kibana alerts define rules in Elastic.
- Relativity Alerts (RDOs) surface the corresponding Kibana alert information in the Relativity UI.
- Only alerts packaged by Relativity have corresponding RDOs.
System Overview
Environment Watch is enabled by the technology components:
| Component | Type | Used for | Setup |
|---|---|---|---|
| Elasticsearch | Third-party software (Elastic) | NoSQL document storage | Installed and configured by customer on own infrastructure |
| Kibana | Third-party software (Elastic) | Alert and dashboard creation and management. | Installed and configured by customer on own infrastructure |
| APM Server | Third-party software (Elastic) | Receives telemetry data from monitored hosts. | Installed and configured by customer on own infrastructure |
| Relativity Alerts | Relativity application (RAP) | Provides the Relativity in-app alert experience. | Standard RAP install |
| Monitoring Agent | Relativity application (MSI) | Collects and transmits metrics from all hosts to the telemetry backend. | Environment Watch installer run on all servers in Relativity Server environment |
| Relativity Server CLI | Relativity application (CLI) | Configures the integration between Relativity and Elastic and imports Relativity-created Kibana objects that are packaged with the Environment Watch solution. | Relativity Server CLI run on Primary SQL Server |
Alerts, Dashboards, and Searching in Kibana
When you set up Environment Watch, all alerts, dashboards, and saved searches (Kibana objects) that have been created and packaged by Relativity will be available to you in Kibana. You can also leverage the telemetry data available when Environment Watch is set up to create your own Kibana objects. Please review Elastic's Kibana guide for full documentation on how to use and create Kibana objects.
A Kibana user with access to your instance and sufficient Kibana permissions is able edit these objects, but any changes you make will be overwritten when you run the Relativity Server CLI. When the CLI is run, all object configuration and settings will revert to the Relativity default values.
Relativity-defined Tags
All Kibana objects packaged in Environment Watch include a set of tags that Relativity has defined. Some of these tags play an important role in the Environment Watch solution, so you should not delete or modify them.
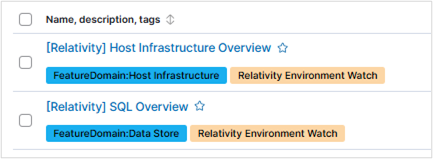
Dashboard tags
- CreatedBy:Relativity - Enables the dashboard link to be visible on the 'Logs & Dashboards' tab in Relativity Alerts.
- FeatureDomain - Enables the dashboard to be grouped with the correct feature domain on the 'Logs & Dashboards' tab in Relativity Alerts.
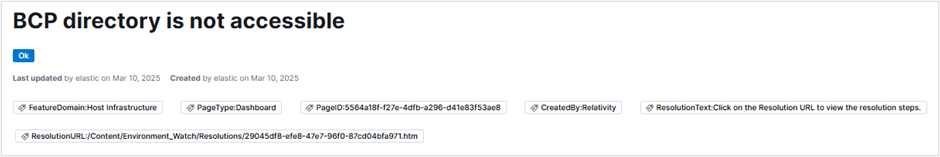
Alert tags
- CreatedBy:Relativity - Enables the alert to interface with it's corresponding Relativity Alert RDO.
- FeatureDomain - Sets the 'Feature Domain' field on the corresponding Relativity Alert RDO and ensures that the alert is surfaced on any Kibana dashboards or saved searches that rely on feature domain.
- PageType - Defines whether the Relativity Alert jump link takes you to a Kibana dashboard, Kibana saved search, or Relativity tab.
- PageID - Defines the Kibana dashboard, Kibana saved search, or Relativity tab that the Relativity Alert jump link will take you to.
- ResolutionText- Defines the pop-up text when you hover over the resolution guidance link on the Relativity Alert notification card.
- ResolutionURL - Defines the resolution guidance documentation page associated with the Relativity Alert.
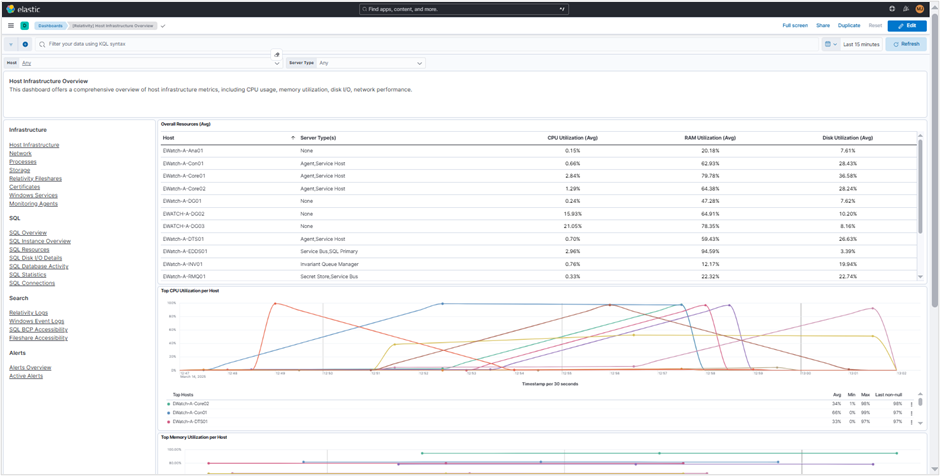
Dashboards in Kibana
Relativity has created and packaged dashboards in Kibana that help you explore system health and activity. You can also create your own dashboards. See Kibana's dashboard guide to get started.
On the left side of all Relativity-created dashboards you will see links to other dashboards and saved searches that help you easily jump into logs, additional details, or related dashboards from the respective feature domain.
Alerts in Kibana
When you run the Environment Watch setup using the Relativity Server CLI, all Kibana Alerts that have been created by Relativity will be imported into your instance. Alerting enables you to define rules, which detect complex conditions within different Kibana apps and trigger actions when those conditions are met. The Relativity Alert RDOs interface with a corresponding Kibana Alert that defines the actual rules. You can also create your own Kibana Alerts, but they will not interface with a corresponding Relativity Alert RDO.
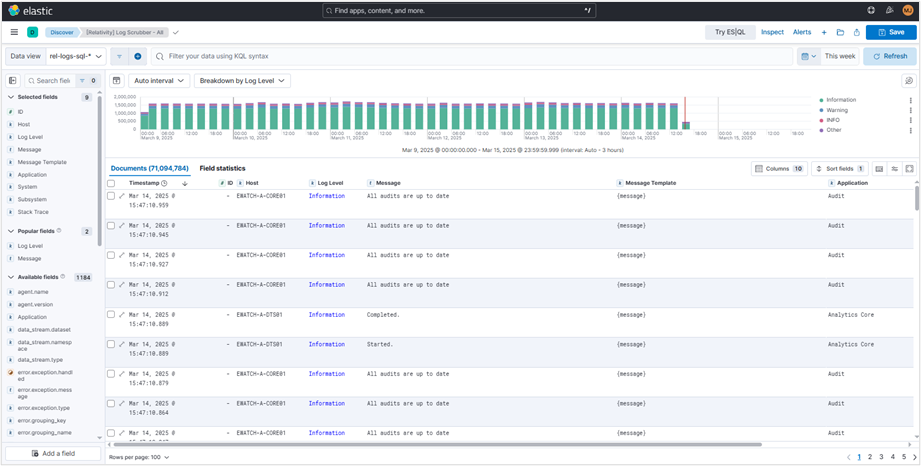
Saved Searches in Kibana
Running the Relativity Server CLI will also import Kibana Saved Searches created by Relativity into your instance. Saved Searches expose relevant pre-filtered log and metric data on dashboards or for searching, and are sometimes used as the "jump link" destination for a Relativity Alert that requires further investigation. Users most commonly interact with Saves Searches via the Kibana Discover feature which lets you quickly search and filter data, get information about the structure of the fields, and display findings in a visualization.
Relativity Alerts application
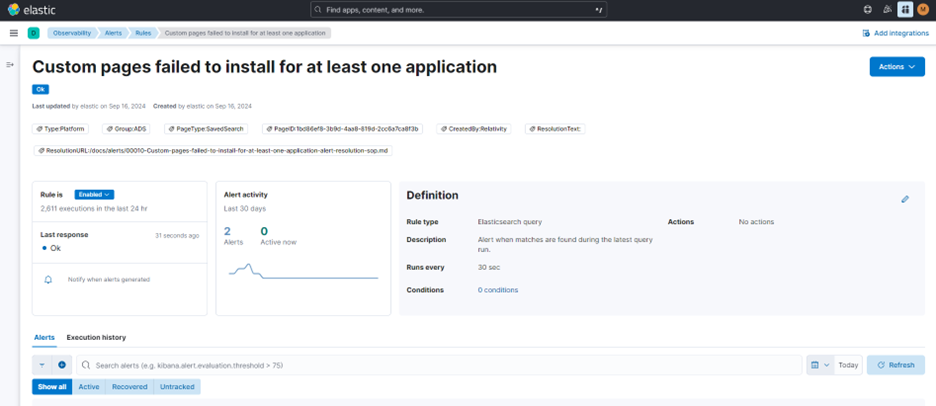
The Relativity Alerts application enables system administrators to monitor their environment within Relativity, providing real-time notifications and resolution guidance for system issues. By integrating with Kibana, the application retrieves alert information and displays it within the Relativity user interface, allowing users to quickly identify and address potential problems.
Each Kibana alert that Relativity has packaged in Environment Watch has a corresponding Relativity Alert Relativity Dynamic Object (RDO) that stores key information about the alert including current state, feature domain, resolution guidance, relevant Relativity tab or Kibana dashboard, and more. Alert RDOs are only created for Kibana alerts that are created and packaged into Environment Watch by Relativity. These alerts are stamped with a "CreatedBy:Relativity" tag in Kibana.
The Alert Manager Agent retrieves alert data from Kibana. This agent is automatically created upon installation of the Alerts application and queries Kibana for updated alert state every 30 seconds.
Relativity Alerts Tab and RDO
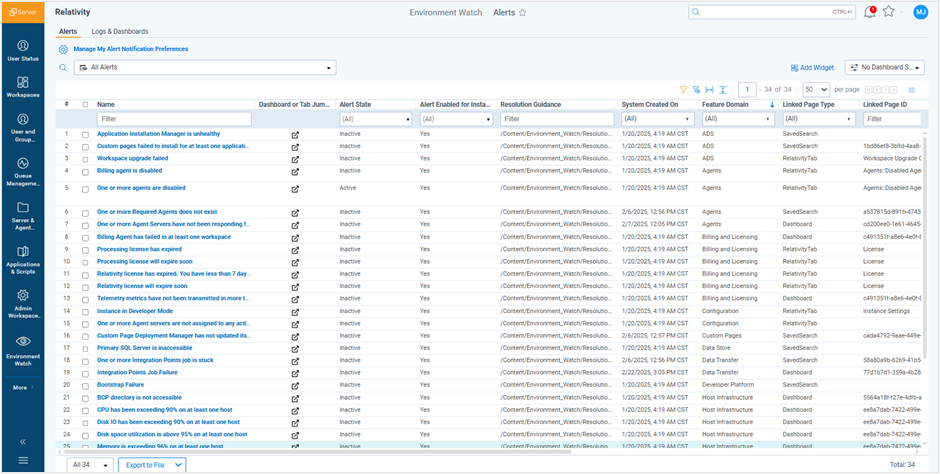
When you have Relativity Alerts installed and Environment Watch is fully configured, you can see all of your alerts and corresponding alert details from the Environment Watch > Alerts tab in Relativity.
- Alerts taband key fields - The Alerts tab includes a list of all Alert RDOs that are mapped to a corresponding Kibana alert. Each Alert includes the following key fields:
- Alert State - is the alert currently active or inactive?
- Alert State Updated - When did the alert last change from inactive to active or active to inactive?
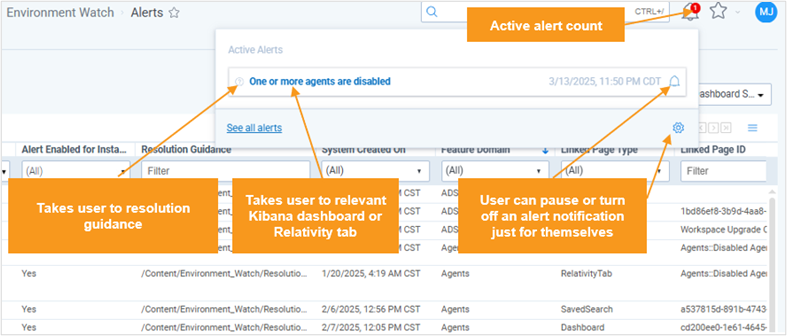
- Dashboard or Tab Jump Link - Alerts are "generalized" in order to reduce noise and minimize the number of overall alerts. To see important details about an alert when active, Relativity will guide you to a Relativity tab or Kibana dashboard to further explore the potential issue. For example, when the 'One ore more agents are disabled' alert is active, the jump link will take you to the Agents tab to see which agents are actually disabled. Or, if the 'Memory is exceeding 96% on at least one host' alert is active, the jump link will take you directly into a Kibana dashboard to see which hosts are currently triggering the memory alert.
Users will need Elastic credentials to log in to Kibana to see dashboards. The Elastic installation guide includes information about a Kibana role that is automatically created by the Relativity Server CLI that we recommend using for your Kibana users that need dashboard view-access.
- Alert Enabled for Instance - If set to No, Relativity will stop querying Kibana for updated alert state information
- Feature Domain - Alerts are grouped by feature domain. You can see a list of all feature domains here.
- Alert Notes - Users in your environment can capture notes on any action or investigation related to an alert.
Relativity Alert Notifications
Relativity Alerts provides you with in-app notifications when an alert is active.
Alert Notification Bell
The alert notification bell in the top right corner of the screen will show you how many alerts are currently active, and when they became active. For each active alert, you can open a link to resolution guidance or the Relativity tab or Kibana dashboard jump link for the alert.
Once Relativity Alerts is installed in an instance, it replaces the Alerts feature in Instance Details referred to as legacy Alerts. Relativity Alerts provides all functionality available in legacy Alerts, along with additional enhancements. Legacy Alerts remain available where Environment Watch is not used.
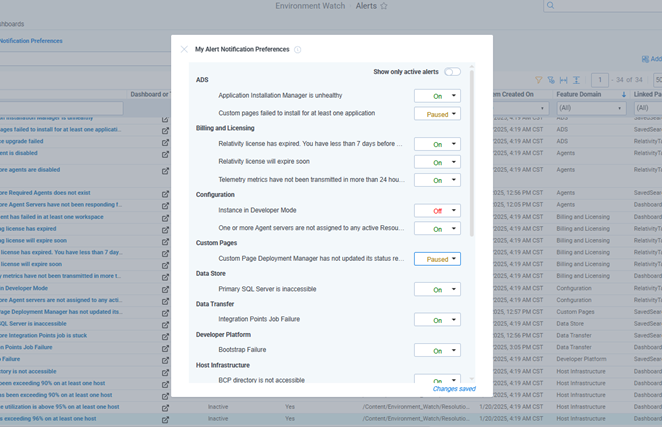
User Notification Preferences
Individual users can pause or turn off alert notifications for themselves. Changing the notification preference does not impact notification visibility for other users in the environment. When you pause or turn off notifications, updates to alert state will still be reflected on the Alerts tab but you will not see notifications on the bell until notifications. When you pause notifications, they will automatically resume after 24 hours. You can pause an alert from the notification card, or pause or turn off from the 'My Alert Notification Preferences' modal.
Relativity Alert Permissions and Configuration Settings
The following permissions and configuration settings are available for Relativity Alerts.
Permissions
All Instance-level System Administrators can see all Alerts, the Alerts tab, and Alert notifications. There is currently no way to extend any Alert permissions to non-System Administrators, and no way to remove or adjust permissions for System Administrators.
Alert Enabled for Instance
System Administrators can adjust this field on individual Alert RDOs to turn an alert on or off for the instance. When turned off, the respective Alert RDO will stop querying Kibana for updated alert state information.
User Alert Notification Preferences
Any user can pause or turn off in-app notifications for individual alerts that they do not care to see. Pausing an alert will suppress in-app notifications for 24 hours.
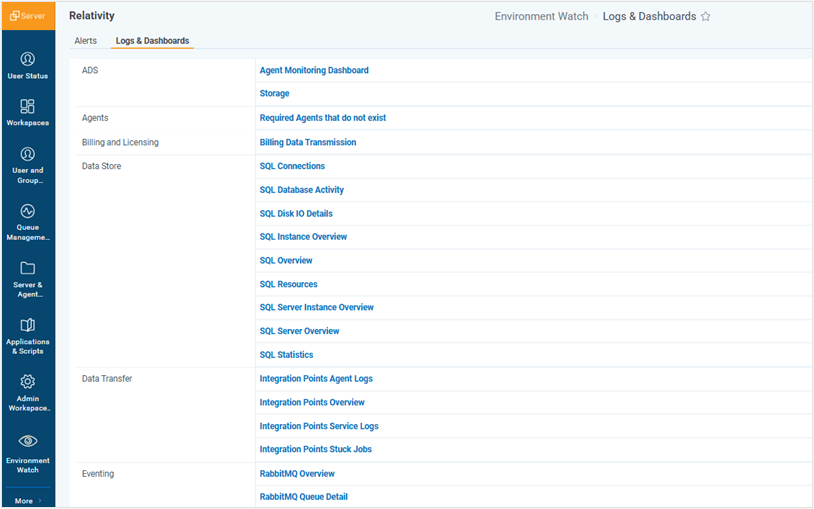
Logs and Dashboards tab
The Logs & Dashboards tab provides links to all Kibana dashboards and saved searches that Relativity has created and packaged as part of Environment Watch.