


Feedback
Pre-requisite Troubleshooting
This document provides troubleshooting steps for common pre-requisites like port configuration.
Port Configuration Troubleshooting
Default Port Reference
The following table summarizes the default ports used by the Elastic Stack components.
| Component | Port | Protocol | Inbound | Outbound | Purpose |
|---|---|---|---|---|---|
| Elasticsearch | 9200 | HTTP/HTTPS | ✅ | Client communication and REST API | |
| 9300 | TCP | ✅ | ✅ | Inter-node communication | |
| Kibana | 5601 | HTTP/HTTPS | ✅ | Kibana web interface | |
| APM Server | 8200 | HTTP/HTTPS | ✅ | APM agent data ingestion |
Elasticsearch Port Issues
Symptoms:
- Elasticsearch fails to bind to default ports.
- "Address already in use" errors in logs.
- Cannot access Elasticsearch via HTTP/HTTPS.
Troubleshooting Steps:
-
Check if Ports are in use: Verify that ports 9200 and 9300 are listening.
Copynetstat -an | findstr ":9200"
netstat -an | findstr ":9300"Expected output:
CopyTCP 0.0.0.0:9200 0.0.0.0:0 LISTENING
TCP 0.0.0.0:9300 0.0.0.0:0 LISTENING -
Identify Conflicting Processes. If a port is in use by another application, identify the process.
CopyGet-NetTCPConnection -LocalPort 9200 -State Listen
Get-NetTCPConnection -LocalPort 9300 -State Listen -
Test Elasticsearch Connectivity:
Copycurl.exe -k -u <username>:<password> -X GET "https://<hostname_or_ip>:9200/" -
Verify Network Binding: Check
C:\elastic\elasticsearch\config\elasticsearch.ymlconfiguration:Copynetwork.host: 0.0.0.0 # For all interfaces
Kibana Port Issues
Symptoms:
- Kibana fails to bind to the default port.
- "EADDRINUSE" errors in logs.
- Cannot access Kibana web interface.
Troubleshooting Steps:
-
Check if Port is in Use:
Copynetstat -an | findstr ":5601"Expected output:
CopyTCP 0.0.0.0:5601 0.0.0.0:0 LISTENING -
Test Kibana Connectivity:
Copy(curl.exe -s -k -u <username>:<password> -X GET "http://<hostname_or_ip>:5601/api/status" | ConvertFrom-Json).status.overall | ConvertTo-Json -Depth 10 -
Verify Network Binding. Check
C:\elastic\kibana\config\kibana.ymlconfiguration:Copyserver.host: "0.0.0.0" # For all interfaces
APM Server Port Issues
Symptoms:
- APM Server fails to bind to the default port.
- "Address already in use" errors in logs.
- APM agents cannot connect to the server.
Troubleshooting Steps:
-
Check if Port is in Use:
Copynetstat -an | findstr ":8200"Expected output:
CopyTCP 0.0.0.0:8200 0.0.0.0:0 LISTENING -
Test APM Server Connectivity:
Copycurl.exe -k "http://<hostname_or_ip>:8200/"Expected output:
Copy{
"build_date": "...",
"build_sha": "...",
"publish_ready": true,
"version": "8.19.8"
} -
Verify Network Binding. Check
C:\elastic\apm-server\apm-server.ymlconfiguration:Copyhost: "0.0.0.0:8200"
General Port Troubleshooting
Firewall Rules
Ensure that Windows Firewall or any other network security software is not blocking the required ports. You may need to create inbound rules to allow traffic on these ports.
Example for Kibana (port 5601):
Copy
New-NetFirewallRule -DisplayName "Kibana Web Interface" -Direction Inbound -Protocol TCP -LocalPort 5601 -Action Allow
Network Connectivity
Use Test-NetConnection to verify that a remote server can reach the port.
Copy
Test-NetConnection -ComputerName <hostname_or_ip> -Port <port_number>
Expected output:
Copy
ComputerName     : <hostname_or_ip>
RemoteAddress    : <ip>
RemotePort       : <port_number>
TcpTestSucceeded : True
Certificate Troubleshooting
SSL/TLS Certificate Issues
Symptoms:
- SSL handshake failures
- "certificate verify failed" errors
- Unable to establish secure connections
- Browser shows "not secure" warning for Elasticsearch URL
Troubleshooting Steps:
-
Verify Secure URL
- The master node domain name URL should be secure for Elasticsearch node servers, agent servers, and web servers.
- The data node domain name URL should be secured for Elasticsearch node servers.
-
Install SSL Certificate in Trusted Store
If your browser shows a "not secure" warning when accessing the Elasticsearch URL, you may need to install the certificate into your trusted store.
-
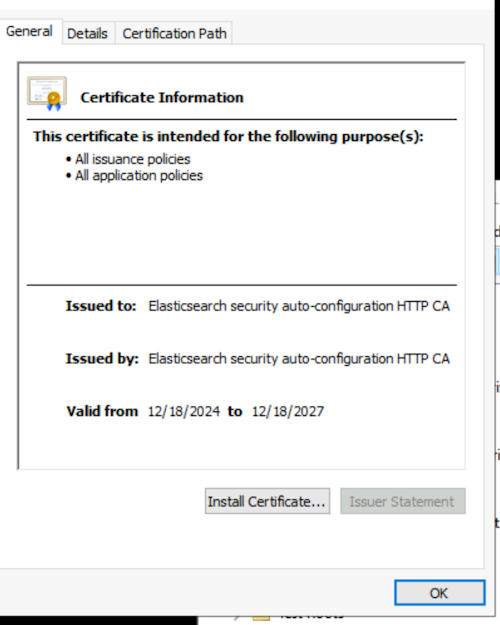
In your browser, view the certificate details and export the root certificate authority (CA) certificate. Save it to a local directory.
-
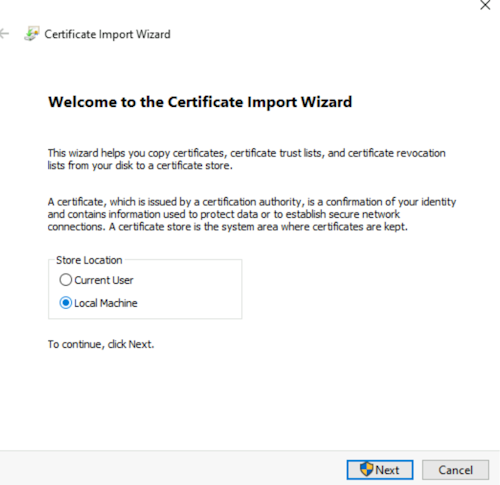
Double-click the downloaded certificate file and click Install Certificate.
-
Select Local Machine and click Next.
-
Select Place all certificates in the following store, click Browse, and select Trusted Root Certification Authorities. Click OK, then Next, and Finish.
-
To confirm, open the Microsoft Management Console (MMC):
- Run
mmc.exe. - Go to File > Add/Remove Snap-in....
- Select Certificates and click Add.
Copy
 - Run
-
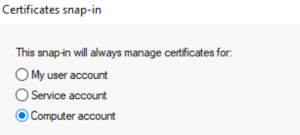
Choose Computer account and click Next, then Finish, and OK.
-
Expand Certificates (Local Computer) > Trusted Root Certification Authorities > Certificates and verify your certificate is listed.
-
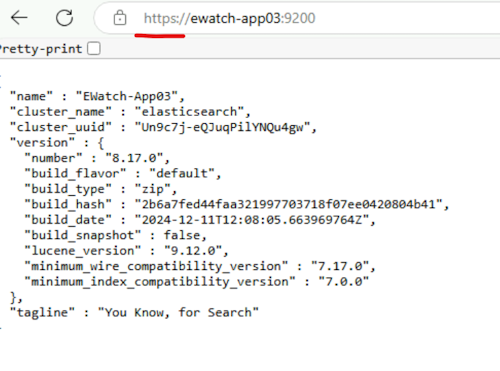
Close your browser and reopen the Elasticsearch URL. It should now show as secure.
-
-
Verify Certificate Path in
elasticsearch.yml.-
Ensure the
elasticsearch.ymlfile points to the correct certificate files. -
Check
C:\elastic\elasticsearch\config\elasticsearch.yml:Copyxpack.security.transport.ssl:
keystore.path: certs/transport.p12
truststore.path: certs/transport.p12
-
-
Check Elasticsearch Logs for SSL Errors
- Navigate to
C:\elastic\elasticsearch\logs\. - Review the
elasticsearch.logfile for any SSL-related errors. - For every error in the Elasticsearch log, provide troubleshooting for that specific error.
- Navigate to