


Feedback
Installing Elastic Stack
Kibana and APM Server are required only for Environment Watch. For DataGrid Audit, they're optional.
Cluster Architecture Decision
Before beginning installation, you must decide on your cluster architecture:
Option 1: Single Unified Cluster (single cluster with multiple nodes)
- One Elasticsearch cluster that contains all data (Environment Watch and Data Grid Audit)
- Simpler to manage and maintain
- Shared resources and infrastructure
- Suitable for most deployments
Option 2: Separate Clusters (multi-cluster)
- Two independent Elasticsearch clusters:
- One dedicated cluster for Environment Watch
- One dedicated cluster for Data Grid Audit
- Complete isolation between workloads
- Independent scaling and resource allocation
- Recommended for very large deployments or when strict data separation is required
For most organizations, Option 1 (Single Unified Cluster) is recommended as it simplifies operations while providing adequate performance and isolation through index management.
Offline Environment Considerations
Official Documentation: For Elastic's guidance on air-gapped installations, see Air-gapped install.
If your environment is offline or air-gapped (no direct internet access), you have two options for obtaining Elastic Stack installation files:
Option 1: Proxy Server (Recommended)
Using a proxy server is the simplest approach for air-gapped environments:
-
Configure a proxy server that has internet access and is reachable from your isolated network.
-
Set proxy environment variables on the target servers before downloading:
Copy# PowerShell - Set proxy for current session
$env:HTTP_PROXY = "http://proxy.yourcompany.com:8080"
$env:HTTPS_PROXY = "http://proxy.yourcompany.com:8080"
# Or configure system-wide proxy in Windows Settings > Network & Internet > Proxy -
Download files normally using the URLs in this guide—traffic will route through the proxy.
Benefits:
- Minimal workflow changes from standard installation
- Automatic dependency resolution for plugins
- Easier to maintain and update over time
Option 2: Manual File Transfer (Air-Gapped)
For fully isolated networks with no proxy access:
-
From an internet-connected machine, download all required files:
- Elasticsearch ZIP (e.g.,
elasticsearch-8.x.x-windows-x86_64.zip) - Kibana ZIP (e.g.,
kibana-8.x.x-windows-x86_64.zip) - APM Server ZIP (e.g.,
apm-server-8.x.x-windows-x86_64.zip) - NSSM executable (from https://nssm.cc/download)
- Any required plugins (download from Elastic's plugin repository)
- Elasticsearch ZIP (e.g.,
-
Transfer files to the air-gapped environment using approved media (USB drive, secure file transfer, etc.).
-
Install plugins offline using local file paths:
Copy# Install mapper-size plugin from local file
.\elasticsearch-plugin install file:///C:/downloads/mapper-size-8.x.x.zip
Considerations:
- Requires more planning and coordination
- Must manually track and transfer all dependencies
- Plugin versions must exactly match Elasticsearch version
Recommendation: If your security policy permits, configure a proxy server for Elastic Stack downloads. This significantly reduces complexity compared to manual file transfers and ensures version compatibility across components.
How to Unblock Downloaded Files
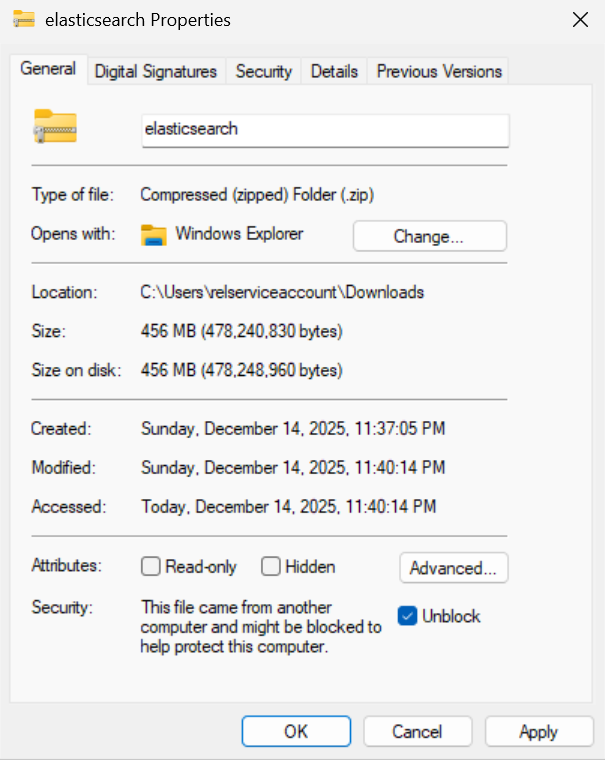
If you download a ZIP file (or another installer/archive) from the internet, Windows may block the file and prevent it from running correctly. Before installing Elastic components, ensure downloaded files are not blocked by Windows security. To unblock a file:
-
Right-click the downloaded file and select Properties.
-
In the General tab, check the box for Unblock at the bottom (if present).
-
Click Apply and then OK.
Show screenshot
Download and Install Elasticsearch 8.x.x or 9.x.x
Official Documentation: For detailed installation guidance, see Elastic's official Elasticsearch installation documentation and Windows installation guide.
Download Elasticsearch 8.x.x or 9.x.x
- Visit Elastic's official download page.
- Download the 8.x.x or 9.x.x Windows ZIP version. Server 2024 supports Elasticsearch 8.x.x and 9.x.x.
- Before extracting, see How to Unblock Downloaded Files.
- Extract the files to
C:\elastic
Install and Configure Elasticsearch 8.x.x or 9.x.x
-
Open an elevated PowerShell window, navigate to Elasticsearch's bin folder (
C:\elastic\elasticsearch-x.x.x\bin), and run the following command to start Elasticsearch and perform the auto-configuration steps:Copy.\elasticsearch.batWhen starting Elasticsearch for the first time, security features are enabled and configured by default:
- Authentication and authorization are enabled, and a password is generated for the elastic built-in superuser.
- Certificates and keys are generated for the transport and HTTP layer, and TLS is enabled and configured with these keys and certificates.
- An enrollment token is generated for Kibana, which is valid for 30 minutes.
Single Cluster with Multiple Nodes: In a single cluster with multiple nodes setup, the enrollment token should be generated on a master-eligible node.
-
Save the token for future reference. Once the enrollment token is displayed, you need to stop Elasticsearch so you can proceed with the next steps. To do this, return to the PowerShell window where Elasticsearch is running and press
Ctrl+Con your keyboard. This will safely terminate the process. The enrollment token will look similar to:CopyEnrollment token for Kibana:
eyJ2ZXIiOiI4LjE3LjMiLCJ...<rest_of_token> -
Open an elevated PowerShell window, navigate to Elasticsearch's bin folder (
C:\elastic\elasticsearch-x.x.x\bin), and run the following command to install Elasticsearch as a Windows service:Copy.\elasticsearch-service.bat installShow sample output
The output will look similar to:
CopyInstalling service : "elasticsearch-service-x64"
Using JAVA_HOME (64-bit): C:\Program Files\Java\jdk-17
The service 'elasticsearch-service-x64' has been installed.
Run Elasticsearch as a Windows Service
-
Open an elevated PowerShell window, navigate to Elasticsearch's bin folder (
C:\elastic\elasticsearch-x.x.x\bin), and run the following command to start the Elasticsearch service:Copy.\elasticsearch-service.bat startShow sample output and alternative method
The output will look similar to:
CopyStarting service : "elasticsearch-service-x64"
The service 'elasticsearch-service-x64' has been started.Alternative: If PowerShell fails to start the service, you can use the Windows Services application:
- Open the Start menu, type
services.msc, and press Enter. - In the Services window, locate
elasticsearch-service-x64. - Right-click the service and select Start.
- Use this method if you encounter permission or environment issues with PowerShell.
- Open the Start menu, type
Stack Monitoring (Optional)
Click to expand Stack Monitoring details
Note: Stack Monitoring is disabled by default. It generates high transaction volume with minimal value. Enable only if needed for troubleshooting.
-
Navigate to the Elasticsearch configuration folder (e.g.,
C:\elastic\elasticsearch-x.x.x\config) and open the elasticsearch.yml file. -
To enable Stack Monitoring (if needed), add the following line:
Copyxpack.monitoring.collection.enabled: false # Set to true only if needed -
Save the changes and restart the Elasticsearch service using the Windows Services application.
Reset the elastic User Password
-
The following command resets the password for the
elasticuser, which is the default superuser (admin) account in Elasticsearch. This account is required for logging in to Kibana and for performing administrative tasks such as managing users, roles, and system settings. -
Navigate to Elasticsearch's bin folder (
C:\elastic\elasticsearch-x.x.x\bin). -
Open an elevated PowerShell window and run the following command:
Copy.\elasticsearch-reset-password.bat -u elasticAlternative: You can also use the interactive mode:
Copy.\elasticsearch-reset-password.bat -i -u elasticThis will prompt you interactively for the user and password reset process.
-
When prompted, press 'Y' to confirm and reset the password. The output will look similar to:
Sample output
CopyPS C:\Elastic\elasticsearch-8.19.8\bin> .\elasticsearch-reset-password -u elastic
warning: ignoring JAVA_HOME=C:\Elastic\elasticsearch-8.19.8\jdk; using bundled JDK
This tool will reset the password of the [elastic] user to an autogenerated value.
The password will be printed in the console.
Please confirm that you would like to continue [y/N]y
Password for the [elastic] user successfully reset.
New value: 3D2nYt7r=rBPCzCCt3iy
PS C:\Elastic\elasticsearch-8.19.8\bin>_ -
Record and securely store the generated password immediately.
The password is shown only once and cannot be retrieved later. Immediately record and securely store the password according to your organization's credential management and security policies. You will need this password for future authentication to Elasticsearch and Kibana.
Configure Node Roles, Discovery and Network (Single Cluster with Multiple Nodes)
Purpose: This section covers configuration for a single Elasticsearch cluster with multiple nodes. All nodes configured here belong to the same cluster (same cluster.name). For multi-cluster architecture (separate independent clusters), see the Multi-Cluster Configuration section below.
Official Documentation: For comprehensive configuration details, see Elasticsearch configuration documentation, Node roles, and Discovery and cluster formation.
Master Nodes (node.roles: ["master"])
- Manage cluster state and coordination
- Lightweight operations - do NOT store data (ensure
datais not present innode.roles) - Resources: 2-4 CPU, 8-16GB RAM
Data Nodes (node.roles: ["data", "ingest"])
- Store indices and execute queries
- Resource-intensive - when configured without the master role, data nodes do not participate in master elections
- Minimum 2 nodes for redundancy
- Resources: Based on data volume (high CPU, RAM, fast storage)
-
Navigate to the Elasticsearch configuration folder (e.g.,
C:\elastic\elasticsearch-x.x.x\config), open the elasticsearch.yml file and configure node roles:Click to expand configuration parameters explanation
- cluster.name:
- node.name:
- node.roles: {List of responsibilities the node performs (master, data, ingest, coordinating, ml)}
- network.host: {The network interface/address Elasticsearch binds to for transport and HTTP. In production, bind to the server's private IP (or a specific hostname), and ensure firewall rules cover ports 9200 and 9300 appropriately. Avoid 0.0.0.0 unless you intentionally expose the service to all interfaces.}
- http.port: {Port for the HTTP REST API (Kibana, APM, curl clients)}
- discovery.seed_hosts:
- cluster.initial_master_nodes:
Sample Production Master Node Configuration
Copy# ---------------------------------- Cluster -----------------------------------
cluster.name: primary-cluster
#
# ------------------------------------ Node ------------------------------------
node.name: es-master-01
node.roles: [ "master" ] # Master only - NO data role
#
# ---------------------------------- Network -----------------------------------
network.host: <primary-master-01-ip>
http.port: 9200
#
# --------------------------------- Discovery ----------------------------------
discovery.seed_hosts: ["<primary-master-01-ip>","<primary-master-02-ip>","<primary-master-03-ip>"]
cluster.initial_master_nodes: ["es-master-01","es-master-02","es-master-03"]Sample Production Data Node Configuration
Copy# ---------------------------------- Cluster -----------------------------------
cluster.name: primary-cluster
#
# ------------------------------------ Node ------------------------------------
#
# Use a descriptive name for the node:
#
node.name: es-data-01
node.roles: [ "data", "ingest" ]
#
# ---------------------------------- Network -----------------------------------
#
network.host: <primary-data-01-ip>
http.port: 9200
#
# --------------------------------- Discovery ----------------------------------
#
discovery.seed_hosts: ["<primary-master-01-ip>","<primary-master-02-ip>","<primary-master-03-ip>"]
cluster.initial_master_nodes: ["es-master-01","es-master-02","es-master-03"] # only on first cluster bootstrap -
For dedicated master nodes, use
node.roles: ["master"]and ensure thatdatais not present innode.roles.
IMPORTANT: Node roles and initial bootstrap configuration
cluster.initial_master_nodes is only for initial bootstrap
The cluster.initial_master_nodes setting is only for the very first cluster formation and must be removed or commented out on all nodes after the cluster has formed successfully to avoid accidental re-bootstrap scenarios.
Node role separation is the most critical production architectural difference
Separating master and data roles is the most critical architectural difference for production environments to achieve optimal performance and stability.
Critical Rules:
- Recommended for production: Separate master and data roles.
- Roles must be explicitly planned for 2-node, 3-node, or larger clusters.
- Master and data nodes have very different configurations.
- Proper master/data node setup is the most important production concern.
Development Environment:
For development purposes, a single node can have all roles assigned. Example configuration:
Copy
# Development single-node configuration
cluster.name: dev-cluster
node.name: dev-node-1
node.roles: ["master", "data", "ingest"]
network.host: localhost
http.port: 9200
Multi-Cluster Configuration (Optional for Single Cluster)
Click to expand Multi-Cluster Configuration details
Purpose: Multi-cluster setup is optional and used when you need to segregate data across independent Elasticsearch clusters (e.g., primary cluster for Environment Watch and a separate audit cluster for DataGrid Audit). Multi-cluster means two independent Elasticsearch clusters with different cluster.name values, connected via Cross-Cluster Search (CCS) or Cross-Cluster Replication (CCR). This is distinct from a single cluster with multiple nodes.
Network Ports for Multi-Cluster Communication
Elasticsearch uses two ports for cluster operations:
- 9200/tcp: HTTP/REST API (for client connections, Kibana, APM, API requests)
- 9300/tcp: Transport layer (for node-to-node communication and cross-cluster connectivity)
IMPORTANT: Port 9300 must be accessible between clusters for Cross-Cluster Search (CCS) or Cross-Cluster Replication (CCR). Ensure firewall rules allow traffic on port 9300 between the primary and audit cluster nodes.
Required Configuration Steps for Multi-Cluster
-
Configure transport port on all nodes in both clusters:
- Add
transport.port: 9300toelasticsearch.yml(default, but explicit configuration recommended)
- Add
-
Add remote_cluster_client role to nodes that will initiate cross-cluster queries:
- Not required on all nodes — only on nodes that will coordinate CCS/CCR requests
- Recommended: Add to dedicated coordinating nodes (nodes with no master or data roles) or create a query tier
- Alternative: Add to master-eligible nodes if they handle queries (less common in large deployments)
- Do NOT add to data-only nodes unless they need to directly initiate cross-cluster queries (rare)
- Primary cluster: Coordinating nodes that will query the audit cluster need this role
- Audit/secondary cluster: Only needed if querying back to the primary cluster
Example coordinating node configuration:
Copynode.roles: [ "remote_cluster_client" ] # Coordinating-only node for cross-cluster queries -
Configure firewall rules:
- Allow bidirectional traffic on port 9300 between primary and audit cluster nodes
- Allow traffic on port 9200 for HTTP/REST API access from Kibana and applications
IMPORTANT: Transport TLS and Remote Cluster Registration Required
CCS/CCR uses the transport layer (port 9300), so Transport Layer Security (TLS) must be properly configured between clusters.
TLS Trust Model Options:
-
Shared CA (Recommended): Use the same Certificate Authority (CA) for both clusters
- Generate one CA using
elasticsearch-certutil ca - Use this CA to sign certificates for nodes in both clusters
- Simplifies trust management — all nodes automatically trust each other
- Both clusters use the same
elastic-stack-ca.p12as truststore
- Generate one CA using
-
Cross-Trust (Alternative): Each cluster has its own CA
- Generate separate CAs for each cluster
- Import the other cluster's CA certificate into each cluster's truststore
- More complex but provides complete cluster isolation
- Required if clusters are managed by different teams/organizations
Additional Requirements:
- Proper Subject Alternative Names (SANs) in certificates to match node addresses
- Consistent TLS settings across all nodes in both clusters
verification_modeshould be consistent (recommendcertificateorfull)
See the Configure Transport Layer Security section for detailed certificate setup instructions. Configure transport TLS before attempting cross-cluster connections.
Configure Primary Cluster for Cross-Cluster Access
On primary cluster nodes that will initiate cross-cluster queries, add the remote_cluster_client role (typically on coordinating or master nodes, not data-only nodes):
Sample Primary Cluster Master Node (with remote_cluster_client)
Copy
# ---------------------------------- Cluster -----------------------------------
cluster.name: primary-cluster
#
# ------------------------------------ Node ------------------------------------
node.name: es-master-01
node.roles: [ "master", "remote_cluster_client" ]  # remote_cluster_client enables cross-cluster queries
#
# ---------------------------------- Network -----------------------------------
network.host: <primary-master-01-ip>
http.port: 9200
transport.port: 9300  # Required for cross-cluster communication
#
# --------------------------------- Discovery ----------------------------------
discovery.seed_hosts: ["<primary-master-01-ip>","<primary-master-02-ip>","<primary-master-03-ip>"]
cluster.initial_master_nodes: ["es-master-01","es-master-02","es-master-03"]
Sample Primary Cluster Data Node Configuration
Copy
# ---------------------------------- Cluster -----------------------------------
cluster.name: primary-cluster
#
# ------------------------------------ Node ------------------------------------
node.name: es-data-01
node.roles: [ "data", "ingest" ]  # Data nodes typically do not need remote_cluster_client
#
# ---------------------------------- Network -----------------------------------
network.host: <primary-data-01-ip>
http.port: 9200
transport.port: 9300  # Required for cross-cluster communication
#
# --------------------------------- Discovery ----------------------------------
discovery.seed_hosts: ["<primary-master-01-ip>","<primary-master-02-ip>","<primary-master-03-ip>"]
cluster.initial_master_nodes: ["es-master-01"]  # only on first cluster bootstrap
Sample Audit Cluster Node Configuration
Configure each audit cluster node with the following settings in elasticsearch.yml:
Sample Audit Cluster Node Configuration
Copy
# ---------------------------------- Cluster -----------------------------------
cluster.name: secondary-cluster
#
# ------------------------------------ Node ------------------------------------
node.name: es-audit-master-01
node.roles: [ "master", "data", "ingest" ]  # Add remote_cluster_client only if querying back to primary
#
# ---------------------------------- Network -----------------------------------
network.host: <secondary-node-01-ip>
http.port: 9200
transport.port: 9300  # Required for cross-cluster communication
#
# --------------------------------- Discovery ----------------------------------
discovery.seed_hosts: ["<secondary-node-01-ip>","<secondary-node-02-ip>","<secondary-node-03-ip>"]
cluster.initial_master_nodes: ["es-audit-master-01","es-audit-master-02","es-audit-master-03"]
Configure Storage Paths
Storage location is critical for Elasticsearch performance
Elasticsearch requires fast storage with high read/write performance.
Development:
- May use OS disk (C:) temporarily
- Still not recommended
Production:
- NEVER use the OS drive (C:)
- Data MUST reside on a dedicated, high-performance disk
- Fast storage (SSD/NVMe) is required
- Never share disk with the operating system
Configuration is simple: Only two settings are needed to redirect data paths.
Understanding Elasticsearch directories:
path.data: Stores indices (the actual indexed documents, inverted indices, and metadata)path.logs: Stores Elasticsearch application logs (startup, errors, warnings, query logs)
These are separate directories because data directories require high-performance storage and regular backups, while log directories primarily need adequate space for troubleshooting and monitoring.
-
Configure
path.dataandpath.logsinelasticsearch.ymlto point to dedicated high-performance volumes:Copy# Production - use dedicated fast disk (D:, E:, or SAN)
path.data: X:/esdata
path.logs: X:/eslogs -
Save the changes and restart the Elasticsearch service:
CopyRestart-Service -Name "elasticsearch-service-x64"Alternative: To restart using the Windows Services application:
- Open the Start menu, type
services.msc, and press Enter. - In the Services window, locate
elasticsearch-service-x64. - Right-click the service and select Restart.
- Open the Start menu, type
Development Environment:
If you are running a single-node development environment and have changed the data path, you may need to reset the elastic user password after restarting the service. Use the following command in the Elasticsearch bin directory:
Copy
.\elasticsearch-reset-password.bat -u elastic
This ensures you can log in to Kibana and perform admin tasks after moving the data directory.
Configure Transport Layer Security for Single Cluster with Multiple Nodes (Production)
Purpose: This step is only required for single cluster with multiple nodes in production. Single-node development environments use Elasticsearch's default auto-generated certificates for transport layer security. A single cluster with multiple nodes requires explicit transport TLS configuration to ensure secure communication between nodes using certificates signed by a Certificate Authority (CA). If you are running a single-node development environment, you can skip this section and proceed to the mapper-size plugin installation.
Official Documentation: For comprehensive transport layer security details, see Elastic's security configuration documentation and TLS encryption documentation.
Create a Certificate Authority (CA)
Purpose: To create a root CA used for signing and issuing certificates for nodes in the cluster. The CA ensures mutual trust among cluster nodes using certificates signed by the same authority.
Single Cluster with Multiple Nodes: Generate certificates on a dedicated master-eligible node server.
Follow these steps on a master-eligible node server:
- Open PowerShell in admin mode.
- Navigate to the bin folder of Elasticsearch (e.g.,
C:\elastic\elasticsearch-x.x.x\bin). - Run the following command:
Copy
.\elasticsearch-certutil ca - This will generate an
elastic-stack-ca.p12file, which acts as the root CA certificate.
Generate Certificates and Private Keys for Nodes
Purpose: To create unique certificates and private keys for each node in the cluster. These certificates, signed by the CA, enable secure inter-node communication.
- Open PowerShell in admin mode.
- Navigate to the bin folder of Elasticsearch (e.g.,
C:\elastic\elasticsearch-x.x.x\bin). - Run the following command:
Copy
.\elasticsearch-certutil cert --ca elastic-stack-ca.p12 - During execution:
- Certificate Name: Provide a unique name for each node (e.g.,
node1.p12,node2.p12). - Password: Set a password (use the same password for all nodes).
- Certificate Name: Provide a unique name for each node (e.g.,
- Repeat this command for each node in the cluster.
- After creation of certificates, copy each certificate to its corresponding node server in the same directory where the certificate was generated.
Distribute Certificates and Configure elasticsearch.yml
Purpose: To distribute the generated certificates to all nodes and configure transport layer security settings in elasticsearch.yml.
Follow these steps on all nodes in the cluster:
-
Copy the generated certificate files to each respective node:
- Copy
elastic-stack-ca.p12to each node (e.g.,C:\elastic\elasticsearch-x.x.x\config\certs\) - Copy the node-specific certificate (e.g.,
node1.p12,node2.p12) to its corresponding node
- Copy
-
On each node, open the
elasticsearch.ymlfile (e.g.,C:\elastic\elasticsearch-x.x.x\config\elasticsearch.yml) -
Add the following transport layer security configuration (update
keystore.pathto match the node-specific certificate):Show transport SSL configuration examples
Example for Node 1:
Copyxpack.security.transport.ssl.enabled: true
xpack.security.transport.ssl.verification_mode: certificate
xpack.security.transport.ssl.keystore.path: certs/node1.p12
xpack.security.transport.ssl.truststore.path: certs/node1.p12Example for Node 2:
Copyxpack.security.transport.ssl.enabled: true
xpack.security.transport.ssl.verification_mode: certificate
xpack.security.transport.ssl.keystore.path: certs/node2.p12
xpack.security.transport.ssl.truststore.path: certs/node2.p12 -
Save the changes to
elasticsearch.yml
Configure Keystore for Secure Password Management
Purpose: To securely store the keystore and truststore passwords, ensuring encrypted access to certificates and private keys.
Follow these steps on all servers and use the same password on all servers:
-
For each node, execute the following commands in the bin folder of Elasticsearch:
Show keystore password commands
Remove Existing Passwords (if any):
- Keystore Password:
Copy
.\elasticsearch-keystore remove xpack.security.transport.ssl.keystore.secure_password - Truststore Password:
Copy
.\elasticsearch-keystore remove xpack.security.transport.ssl.truststore.secure_password
Add New Passwords:
-
Keystore Password:
Enter the password created during certificate generation when prompted.
Copy.\elasticsearch-keystore add xpack.security.transport.ssl.keystore.secure_password -
Truststore Password:
Enter the same password used during certificate generation when prompted.
Copy.\elasticsearch-keystore add xpack.security.transport.ssl.truststore.secure_password
- Keystore Password:
Use identical passwords on all nodes in the cluster for proper inter-node communication.
Install the 'mapper-size' plugin
Purpose: To enable Elasticsearch to index the size of each document in bytes, which is required for storage management and reporting purposes.
-
Open an elevated PowerShell window, navigate to Elasticsearch's bin folder (
C:\elastic\elasticsearch-x.x.x\bin), and run the following command to install the 'mapper-size' plugin:Copy.\elasticsearch-plugin install mapper-size -
To verify the 'mapper-size' plugin is installed, run:
Copy.\elasticsearch-plugin list -
Restart the Elasticsearch service by running the following command in an elevated PowerShell session:
CopyRestart-Service -Name "elasticsearch-service-x64"Show sample output
The output will look similar to:
CopyWARNING: Waiting for service 'Elasticsearch x.x.x (elasticsearch-service-x64) (elasticsearch-service-x64)' to stop...
Configure JVM Heap Settings (Production)
Official Documentation: For detailed JVM configuration guidance, see Elastic's JVM heap size documentation.
Proper JVM heap configuration is critical for Elasticsearch performance and stability.
-
Navigate to
C:\elastic\elasticsearch-x.x.x\config\jvm.options -
Set heap size to 50% of available RAM, with a maximum of 31GB per node:
Show JVM heap configuration
Copy# Xms represents the initial heap size
# Xmx represents the maximum heap size
# Both values should be equal to avoid heap resizing
-Xms16g
-Xmx16gProduction Sizing Guidelines:
- For 32GB RAM server:
-Xms16g -Xmx16g - For 64GB RAM server:
-Xms31g -Xmx31g(do not exceed 31GB) - For 128GB RAM server:
-Xms31g -Xmx31g(leave remainder for OS and Lucene)
- For 32GB RAM server:
- Never set heap size above 31GB (compressed OOPs threshold)
- Always set Xms and Xmx to the same value
- Reserve at least 50% of RAM for the operating system and Lucene file cache
- Monitor heap usage and adjust based on actual workload
- Restart the Elasticsearch service after making changes:
Copy
Restart-Service -Name "elasticsearch-service-x64"
Verify Elasticsearch Server
-
To verify Elasticsearch is running, open an elevated Command Prompt and run the following command (replace
<username>,<password>, and<hostname_or_ip>with your actual values). In production do NOT use-k; validate the server certificate using the CA certificate you installed:Copycurl.exe -u <username>:<password> --cacert "C:\elastic\elasticsearch-x.x.x\config\certs\http_ca.crt" --ssl-no-revoke https://<hostname_or_ip>:9200Or with PowerShell (validates TLS by default):
CopyInvoke-RestMethod -Uri https://<hostname_or_ip>:9200 -Credential (Get-Credential)
Browser Access: While you can navigate to https://<hostname_or_ip>:9200 in a browser, authentication may not work reliably in all browsers. The curl or PowerShell methods above are recommended for consistent results.
-
The response should show basic cluster information in JSON format if the server is running and accessible.
Sample JSON response
Copy{
"name" : "emttest",
"cluster_name" : "elasticsearch",
"cluster_uuid" : "q5VtYDCQT2iNHU9dOdqomw",
"version" : {
"number" : "8.x.x",
"build_flavor" : "default",
"build_type" : "zip",
"build_hash" : "a091390de485bd4b127884f7e565c0cad59b10d2",
"build_date" : "2025-02-28T10:07:26.089129809Z",
"build_snapshot" : false,
"lucene_version" : "9.12.0",
"minimum_wire_compatibility_version" : "7.17.0",
"minimum_index_compatibility_version" : "7.0.0"
},
"tagline" : "You Know, for Search"
}
Install and Configure Kibana (Required for Environment Watch Only)
Kibana is required for Environment Watch only.
Official Documentation: For detailed Kibana installation guidance, see Elastic's official Kibana installation documentation and Windows installation guide.
Download Kibana 8.x.x or 9.x.x
- Download the 8.x.x or 9.x.x Windows ZIP version of Kibana from Elastic's official Kibana download page.
- Verify that the Elasticsearch service is installed and running before Kibana setup.
- Before extracting, see How to Unblock Downloaded Files.
- Extract the files to
C:\elastic(e.g.,C:\elastic\kibana-x.x.x).
Start Kibana from the command line
-
Navigate to Kibana's
binfolder (e.g.,C:\elastic\kibana-x.x.x\bin). -
Open an elevated PowerShell window and run the following command:
Copy.\kibana.bat -
If successful, you should see output indicating that the Kibana server has started and is listening on port 5601. Look for lines similar to:
Show sample output
```text [INFO][server][http] http server running at http://localhost:5601 ... kibana has not been configured Go to https://localhost:5601/?code=xyz to get started ```
Enroll Kibana
- In your terminal, click the generated link to open Kibana in your browser.
- In your browser, paste the enrollment token that was generated in the terminal when you started Elasticsearch, then click the Configure Elastic button to connect your Kibana instance with Elasticsearch. See where the enrollment token is generated.
- If the token has expired, generate a new one by running the following command in the Elasticsearch's bin folder (e.g.,
C:\elastic\elasticsearch-x.x.x\bin).
Single Cluster with Multiple Nodes: Run this command on a master-eligible node server.
Copy
.\elasticsearch-create-enrollment-token.bat --scope kibana
Sample output
Copy
eyJ2ZXIiOiI4LjE0LjAiLCJhZHIiOlsiMTAuMC4yLjI6OTIwMCJdLCJmZ3IiOiI4ZGE1MWZkYTExZmM1ZDAwNDBhZWZlNTJlNmRiYzQ5ZTM2NmYxYTkyOGIwY2NiMzExOGY0MWFjZTczODNkZDliIiwia2V5IjoiOGFfc1BKZ0Jra09qNlh6dngycS06bG5sWkNEMnpSbFNiZjZZclpRSHF6dyJ9
- Log in to Kibana as the
elasticuser with the password that was generated when you started Elasticsearch. - You will see the Kibana enrollment page. Paste the enrollment token you saved earlier and click the enrollment button.
Enable TLS for Kibana
Recommended Configuration Order: This section describes how to enable HTTPS for Kibana's server interface. You can configure TLS either before or after enrollment, but note that:
- If configuring TLS before enrollment: You must access Kibana via HTTPS during the enrollment process, and ensure your certificates are properly configured with correct SANs.
- If configuring TLS after enrollment: Complete the enrollment steps above first using HTTP, then return here to enable HTTPS.
Official Documentation: For comprehensive TLS configuration details, see Elastic's Kibana security documentation and Encrypt communications in Kibana.
Use elasticsearch-certutil
Note: For single cluster with multiple nodes, run the following commands on a master-eligible node server.
-
Open an elevated PowerShell window in
C:\elastic\elasticsearch-x.x.x\bin. -
Create CA by running the following command:
Copy.\elasticsearch-certutil.bat ca --silent --pem --out "C:\elastic\secrets\kibana_ca.zip" -
Extract zip contents into
C:\elastic\secrets\ca\(you should have ca.crt and ca.key). -
Create server cert for Kibana. Build SAN args with your DNS and IPs, e.g.,
--dns <fqdn> --dns <shortname> --ip <server-ip>, then run:Copy.\elasticsearch-certutil.bat cert --silent --pem --ca-cert "C:\elastic\secrets\ca\ca.crt" --ca-key "C:\elastic\secrets\ca\ca.key" --name kibana [SAN args] --out "C:\elastic\secrets\kibana_server.zip"Example with actual values:
Copy.\elasticsearch-certutil.bat cert --silent --pem --ca-cert "C:\elastic\secrets\ca\ca.crt" --ca-key "C:\elastic\secrets\ca\ca.key" --name kibana --dns <fqdn> --dns <shortname> --ip <server-ip> --out "C:\elastic\secrets\kibana_server.zip" -
Extract zip contents into
C:\elastic\secrets\kibana\to get kibana.crt and kibana.key. -
Create
C:\elastic\kibana-x.x.x\config\certsdirectory. -
Copy the certificate files:
CopyC:\elastic\secrets\kibana\kibana.crt -> C:\elastic\kibana-x.x.x\config\certs\kibana.crt
C:\elastic\secrets\kibana\kibana.key -> C:\elastic\kibana-x.x.x\config\certs\kibana.key
C:\elastic\secrets\ca\ca.crt -> C:\elastic\kibana-x.x.x\config\certs\ca.crt -
Install CA to Windows trust (Local Machine Root) so browsers trust Kibana. Run mmc, add Certificates snap-in for Computer account, import ca.crt under Trusted Root Certification Authorities, or run:
Copycertutil.exe -addstore -f Root "C:\elastic\kibana-x.x.x\config\certs\ca.crt"
Configure kibana.yml
-
Open
C:\elastic\kibana-x.x.x\config\kibana.ymland set:Show Kibana TLS configuration
Copyserver.host: "<bind address>" # Use the specific interface or hostname; avoid 0.0.0.0 unless required
server.port: 5601
server.publicBaseUrl: "https://your.kibana.host:5601"
server.ssl.enabled: true
server.ssl.certificate: "C:/elastic/kibana/config/certs/kibana.crt"
server.ssl.key: "C:/elastic/kibana/config/certs/kibana.key"
Use forward slashes in paths (C:/...) to avoid YAML escape issues.
Generate Kibana encryption keys
Official Documentation: For encryption key details, see Elastic's Kibana encryption keys documentation.
Important: Skipping the steps below will cause the Relativity Server CLI to fail.
-
Open an elevated PowerShell window, navigate to the Kibana bin folder (e.g.,
C:\elastic\kibana-x.x.x\bin), and run the following command:Copy.\kibana-encryption-keys generate -
If successful, you will see output showing the generated encryption keys. For example:
Sample output
Copyxpack.encryptedSavedObjects.encryptionKey: "<randomly-generated-key-1>"
xpack.reporting.encryptionKey: "<randomly-generated-key-2>"
xpack.security.encryptionKey: "<randomly-generated-key-3>" -
Store encryption keys securely (production)
Do NOT paste encryption keys or other secrets into kibana.yml in production or commit them to source control. Use the kibana-keystore (recommended) or an external secrets manager.
Option A: Add keys to Kibana keystore (Recommended)
-
Example (elevated PowerShell) to add the generated keys to the Kibana keystore:
Show keystore commands
Copycd C:\elastic\kibana-x.x.x\bin
# Create the keystore if it doesn't exist
.\kibana-keystore.bat create
# Add encryption keys (interactive)
.\kibana-keystore.bat add xpack.encryptedSavedObjects.encryptionKey
.\kibana-keystore.bat add xpack.reporting.encryptionKey
.\kibana-keystore.bat add xpack.security.encryptionKey
# Or add non-interactively (stdin)
Write-Output '<randomly-generated-key-1>' | .\kibana-keystore.bat add xpack.encryptedSavedObjects.encryptionKey --stdin
Write-Output '<randomly-generated-key-2>' | .\kibana-keystore.bat add xpack.reporting.encryptionKey --stdin
Write-Output '<randomly-generated-key-3>' | .\kibana-keystore.bat add xpack.security.encryptionKey --stdin -
After adding secrets, restart Kibana so it reads the keystore.
-
Verify that the keystore file has restrictive ACLs so only the Kibana service account can read it.
-
Restart Kibana by opening an elevated PowerShell, navigating to the Kibana bin folder (e.g.,
C:\elastic\kibana-x.x.x\bin), and running the following command:Copy.\kibana.bat -
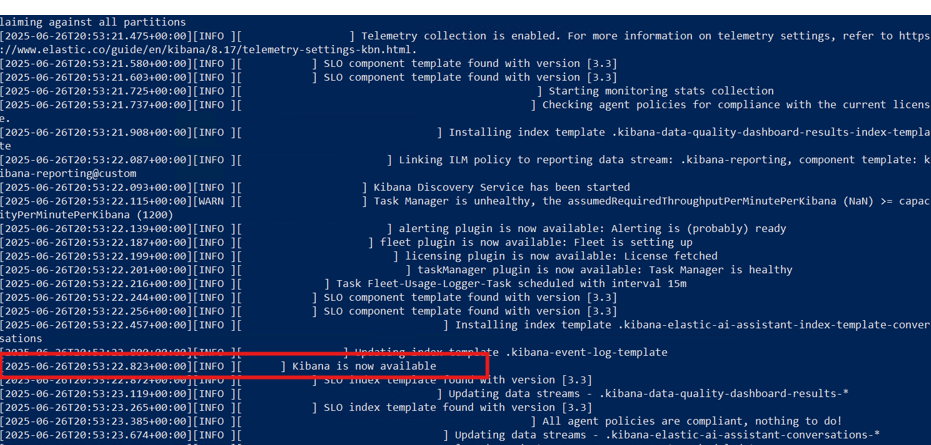
To verify success, check the terminal output for lines indicating that Kibana has started successfully.
Show screenshot
-
After Kibana has restarted, open a browser and go to
https://<hostname_or_ip>:5601. -
Log in using the
elasticusername and the password you generated earlier. This verifies that Kibana is running and your credentials are working. -
For more details, refer to the official documentation: https://www.elastic.co/guide/en/kibana/current/kibana-encryption-keys.html
Option B: Add keys directly to kibana.yml (Development only)
Warning: This method is only suitable for development environments. For production, always use the keystore method above.
-
Open
C:\elastic\kibana-x.x.x\config\kibana.ymland add the following lines with your generated keys:Copyxpack.encryptedSavedObjects.encryptionKey: "<randomly-generated-key-1>"
xpack.reporting.encryptionKey: "<randomly-generated-key-2>"
xpack.security.encryptionKey: "<randomly-generated-key-3>"
Create Kibana Windows Service
IMPORTANT: Running Kibana as a Windows Service is Optional
Environment Watch does NOT require Kibana to run as a Windows service, nor does it require the use of NSSM. NSSM is a commonly used open-source tool to help run applications as services, but it is not mandatory. You can run Kibana manually from the code line if you prefer, and this will work perfectly for development and most production scenarios.
Only use NSSM if you want Kibana to start automatically as a service on Windows. If you do not wish to use NSSM, simply run kibana.bat manually:
Copy
C:\elastic\kibana-x.x.x\bin\kibana.bat
Kibana does not install as a Windows service by default. We recommend using NSSM (a commonly used open-source tool) to run Kibana as a Windows service.
Open an elevated PowerShell window, navigate to "C:\nssm-2.24\win64", and run the following command:
Copy.\nssm.exe install kibanaThis will open a popup to create a Windows service for Kibana.
In the Application tab:
- Path:
C:\elastic\kibana-x.x.x\bin\kibana.bat - Startup directory:
C:\elastic\kibana-x.x.x\bin
Editing Kibana Service Properties: If you accidentally install the Kibana service before completing your configuration (for example, by pressing Return too early in the NSSM dialog), you can easily edit the service properties afterward. This allows you to update the application path, log file settings, or other options without reinstalling the service. To edit the service properties, open an elevated PowerShell window and run the following command:
C:\nssm-2.24\win64\nssm.exe edit kibana- Path:
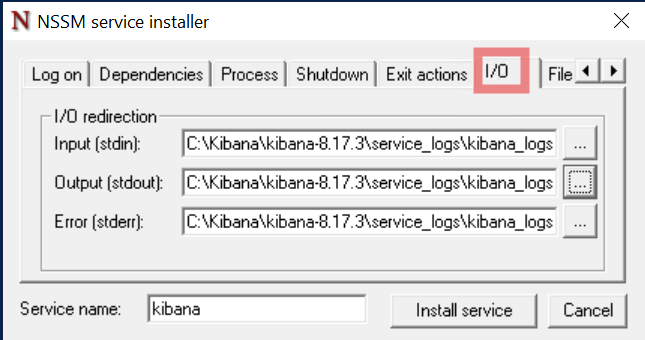
In the I/O tab, configure log file storage:
- Create a folder:
C:\elastic\kibana-x.x.x\service_logs - Create a blank log file:
C:\elastic\kibana-x.x.x\service_logs\kibana_service.log
- Create a folder:
Copy the full log file path into the stdout and stderr sections.
Show screenshot
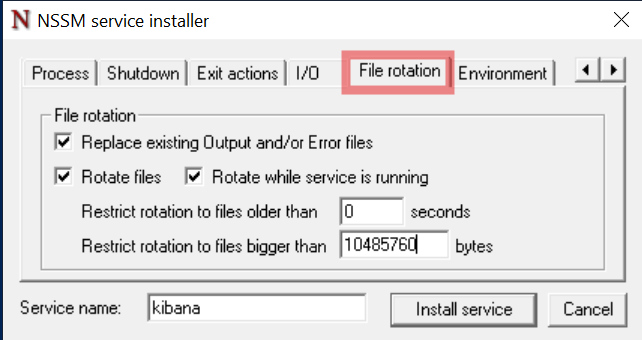
In the File rotation tab, check all boxes and enter
10485760bytes so a new log file is generated for every 10 MB of logs.Show screenshot
Click the Install service button to create the Windows service for Kibana.
Service account (recommended)
- Create a dedicated, least-privilege Windows service account (for example:
svc_kibana). Do not run Kibana under LocalSystem in production. - In NSSM, you can set the account under the Log On tab in the GUI after installing the service, or via command:
Copy
C:\nssm-2.24\win64\nssm.exe set kibana ObjectName "DOMAIN\svc_kibana" "<service-account-password>" - Verify that the service account has read access to Kibana installation, config, certs and the kibana keystore, and only those privileges required.
- Create a dedicated, least-privilege Windows service account (for example:
Go to the Services app in Windows, search for the
kibanaservice, right click, and start the service.Right click on the service and open Properties to change the startup type to Automatic, so Kibana runs automatically on system startup.
Verify that Kibana is running by opening it in your browser.
It is normal for Kibana to take 1-5 minutes to become accessible after starting the service, depending on your system. Please be patient while it starts up.
Verify Kibana Server
- Open a browser and go to
https://<hostname_or_ip>:5601. - Log in using the
elasticusername and the password you generated earlier. - You should see the Kibana home page, confirming successful access.
Register Remote Cluster Connection (Multi-Cluster Setup Only)
Click to expand Register Remote Cluster Connection details
Note: This section is only required if you configured a multi-cluster architecture as described in the Multi-Cluster Configuration section. Skip this section if you are running a single cluster.
After both clusters are running and Kibana is configured, you can register the remote cluster connection to enable Cross-Cluster Search (CCS) or Cross-Cluster Replication (CCR).
Remote Cluster Connection Modes
Elasticsearch supports two modes for remote cluster connections:
Sniff mode (default, shown below): Discovers all eligible nodes in the remote cluster
- Requires direct network connectivity from local cluster nodes to all remote cluster nodes on port 9300
- Suitable for flat networks where all nodes can communicate directly
- More efficient for large-scale deployments
Proxy mode: Connects through specific gateway nodes
- Only requires connectivity to designated gateway/seed nodes on port 9300
- Suitable for segmented networks with firewall restrictions
- Configure by adding
"mode": "proxy"to the remote cluster settings - Gateway nodes must have the
remote_cluster_clientrole
Network Requirements:
- For sniff mode: Port 9300 must be accessible from primary cluster nodes to all audit cluster nodes
- For proxy mode: Port 9300 must be accessible only to the specified seed/gateway nodes
- Verify firewall rules allow the required connectivity based on your chosen mode
Register remote cluster connection from the primary cluster:
Open Kibana and navigate to Dev Tools (Management > Dev Tools), then run the following command to register the audit cluster:
Show remote cluster registration commands
Sniff mode (default):
CopyPUT _cluster/settings
{
"persistent": {
"cluster": {
"remote": {
"audit-cluster": {
"seeds": ["<secondary-node-01-ip>:9300", "<secondary-node-02-ip>:9300", "<secondary-node-03-ip>:9300"]
}
}
}
}
}Proxy mode (for segmented networks):
CopyPUT _cluster/settings
{
"persistent": {
"cluster": {
"remote": {
"audit-cluster": {
"mode": "proxy",
"proxy_address": "<gateway-node-ip>:9300"
}
}
}
}
}Note: Replace
audit-clusterwith your desired cluster alias and update the seed host addresses to match your audit cluster node IPs.Verify remote cluster connectivity:
Show sample response
You should see the audit cluster listed with connection status. Example response:
Copy{
"audit-cluster": {
"connected": true,
"mode": "sniff",
"seeds": ["<secondary-node-01-ip>:9300", "<secondary-node-02-ip>:9300", "<secondary-node-03-ip>:9300"],
"num_nodes_connected": 3,
"max_connections_per_cluster": 3,
"initial_connect_timeout": "30s"
}
}Test Cross-Cluster Search (Optional):
Show test query
Once registered, you can query indices in the remote cluster using the cluster alias prefix:
CopyGET audit-cluster:*/_search
{
"query": {
"match_all": {}
}
}
Install and Configure APM Server (Required for Environment Watch Only)
APM Server is required for Environment Watch only.
Official Documentation: For detailed APM Server installation and configuration guidance, see Elastic's official APM Server documentation and APM Server configuration.
Prerequisites to Set Up APM Server
- Elastic and Kibana should be configured and services should be up and running.
Download APM Server 8.x.x or 9.x.x
- Visit Elastic's APM Server page.
- Download the 8.x.x or 9.x.x Windows ZIP file.
- Before extracting, see How to Unblock Downloaded Files.
- Extract the files to
C:\elastic(e.g.,C:\elastic\apm-server-x.x.x).
Enable TLS for APM
Use elasticsearch-certutil
Note:Single Cluster with Multiple Nodes: Run the following commands on the master node server.
Open an elevated PowerShell window in
C:\elastic\elasticsearch-x.x.x\bin.Create CA by running:
Copy.\elasticsearch-certutil.bat ca --silent --pem --out "C:\elastic\secrets\apm_ca.zip"Extract apm_ca.zip contents into
C:\elastic\secrets\apm-ca\(you should have ca.crt and ca.key inside the folder).Create server cert for APM. Build SAN args with your DNS and IPs, e.g.,
--dns <fqdn> --dns <shortname> --ip <server-ip>, then run:Copy.\elasticsearch-certutil.bat cert --silent --pem --ca-cert "C:\elastic\secrets\apm-ca\ca.crt" --ca-key "C:\elastic\secrets\apm-ca\ca.key" --name apm-server [SAN args] --out "C:\elastic\secrets\apm-server.zip"Extract zip contents into
C:\elastic\secrets\apm-server\to get apm-server.crt and apm-server.key.Create
C:\elastic\apm-server-x.x.x\config\certsdirectory.Copy the certificate files:
CopyC:/elastic/secrets/apm-server/apm-server.crt -> C:/elastic/apm-server-x.x.x/config/certs/apm-server.crt
C:/elastic/secrets/apm-server/apm-server.key -> C:/elastic/apm-server-x.x.x/config/certs/apm-server.key
C:/elastic/secrets/apm-ca/ca.crt -> C:/elastic/apm-server-x.x.x/config/certs/ca.crtInstall CA to Windows trust (Local Machine Root) so browsers trust APM. Run mmc, add Certificates snap-in for Computer account, import ca.crt under Trusted Root Certification Authorities, or run:
Copycertutil.exe -addstore -f Root "C:\elastic\apm-server-x.x.x\config\certs\ca.crt"
Configure APM Server
Create an API Key for APM / Beats
- Log in to Kibana at
https://<hostname_or_ip>:5601using theelasticuser. - Use the global search to find API keys and select it.
- Click Create API key.
- Enter a descriptive name (e.g., "APM Server Key").
- Click Create API key.
- In Privileges, select Beats for recommended permissions.
- The system will generate the API key. Copy and securely store the generated
idandapi_keyvalues.
Copy and save the id and api_key values immediately. Store them securely according to your organization's credential management and security policies.
Edit the APM Server Configuration
Navigate to the APM Server folder (e.g.,
C:\elastic\apm-server-x.x.x).Open
apm-server.ymlin a text editor.Update the file to match the following sample configuration, replacing all placeholder values with your actual environment values:
Show sample apm-server.yml configuration
Copyapm-server:
host: "0.0.0.0:8200"
ssl.enabled: true
ssl.certificate: "C:/elastic/apm-server-x.x.x/config/certs/apm-server.crt"
ssl.key: "C:/elastic/apm-server-x.x.x/config/certs/apm-server.key"
output.elasticsearch:
hosts:
- "https://your-elasticsearch-host:9200"
api_key: "your_api_id:your_api_key"
ssl.enabled: true
ssl.certificate_authorities:
- "C:/elastic/elasticsearch-x.x.x/config/certs/http_ca.crt"
ssl.verification_mode: full
setup.kibana:
host: "https://your-kibana-host:5601"
ssl.enabled: true
ssl.certificate_authorities:
- "C:/elastic/elasticsearch-x.x.x/config/certs/http_ca.crt"
instrumentation:
enabled: true
environment: production
# Stack Monitoring for APM Server (disabled by default)
# Uncomment and set enabled: true only if needed for troubleshooting
# monitoring:
# enabled: false
# elasticsearch:
# hosts:
# - "https://your-elasticsearch-host:9200"
# api_key: "your_api_id:your_api_key"
# ssl:
# certificate_authorities:
# - "C:/elastic/elasticsearch-x.x.x/config/certs/http_ca.crt"
Certificate Paths:
- APM Server certificates: Created in the Enable TLS for APM section, typically stored in
C:/elastic/apm-server-x.x.x/config/certs/ - Elasticsearch HTTP CA certificate: Auto-generated during Elasticsearch first run, located at
C:/elastic/elasticsearch-x.x.x/config/certs/http_ca.crt - Replace
x.x.xwith your actual version numbers (e.g.,8.19.8or9.0.0) - Replace
your-elasticsearch-hostandyour-kibana-hostwith actual hostnames or IP addresses - Replace
your_api_id:your_api_keywith the API key values from the previous step
Install APM Server as a Windows Service
Open an elevated PowerShell window.
Change directory to the APM Server installation folder (e.g.,
cd C:\elastic\apm-server-x.x.x).Run the following command to install the service:
CopyPowerShell.exe -ExecutionPolicy Unrestricted -File .\install-service.ps1The output should look similar to:
CopyInstalling service apm-server...
Service "apm-server" has been successfully installed.
Start the APM Server service
Open an elevated PowerShell window and run the following command:
CopyStart-Service -Name "apm-server"
If PowerShell fails to start the APM Server service: You can use the Windows Services application as an alternative:
- Open the Start menu, type
services.msc, and press Enter. - In the Services window, locate apm-server.
- Right-click the service and select Start.
- Use this method if you encounter permission or environment issues with PowerShell.
- After instrumentation is configured, verify it in Kibana:
- Navigate to APM in the Kibana menu
- Confirm that services and traces appear in the APM interface
- Check that the APM Server is successfully receiving data
Verify APM Server
Open an elevated Command Prompt and run the following command (replace <hostname_or_ip> with your actual value). Validate TLS using the CA certificate rather than using -k:
Copy
curl.exe --cacert C:\elastic\apm-server-x.x.x\config\certs\ca.crt https://<hostname_or_ip>:8200
On Windows, use curl.exe to avoid PowerShell aliasing.
Or with PowerShell:
Copy
Invoke-RestMethod -Uri https://<hostname_or_ip>:8200
The response should indicate publish_ready is true and will look similar to:
Show sample response
Copy
{
  "build_date": "2025-02-27T18:17:35Z",
  "build_sha": "f6b917b725e1a22af433e5b52c5c6f0ff9164adf",
  "publish_ready": true,
  "version": "8.x.x"
}
Alternative to browser:
If you cannot access the APM Server endpoint in a browser, use the above curl or Invoke-RestMethod commands in your terminal to verify the server status. This is useful for headless environments or remote servers.
Additional Setup and Verification
Add Elastic APM Integration Package
Skipping the steps below will cause the Relativity Server CLI to fail.
Log in to Kibana and navigate to Integrations (use the menu or search bar).
Search for "Elastic APM" and select it from the integration catalog.
Click the Add Elastic APM button in the top right corner.
Configure the integration:
- Integration name: Enter a descriptive name (e.g., "APM Server")
- Host:
<hostname_or_ip>:8200 - URL:
https://<hostname_or_ip>:8200
Click Save and Continue.
Select Add Elastic Agent later (Agent is not required for initial setup).
Verify APM Data View
Before proceeding with EW CLI, check if the APM data view is created in Kibana:
- Open a browser and go to https://<hostname_or_ip>:5601
- Log in using elastic credentials
- Navigate to Discover (use the menu or search bar)
- Confirm the APM data view is present in the data view dropdown (e.g.,
traces-apm*,metrics-apm*,logs-apm*)
Verify Cluster Health
Click to expand Verify Cluster Health details
1. Open an elevated Command Prompt and run the following command (replace `username`, `password`, and `hostname_or_ip` with your actual values). In production validate TLS with the CA certificate:Copy
```bash
curl.exe -u <username>:<password> --cacert C:\elastic\secrets\ca\ca.crt https://<hostname_or_ip>:9200/_cat/health
```

> On Windows, use `curl.exe` to avoid PowerShell aliasing.

Or with PowerShell:

```powershell
Invoke-RestMethod -Uri https://<hostname_or_ip>:9200/_cat/health -Credential (Get-Credential)
```
Browser Access: While you can navigate to https://<hostname_or_ip>:9200/_cat/health in a browser, authentication may not work reliably in all browsers. The curl or PowerShell methods above are recommended for consistent results.
Show sample response
You should see a response similar to:
Copy1690219200 10:00:00 elasticsearch green 1 1 0 0 0 0 0 0 - 100.0%The word
greenin the response means the cluster is healthy. The wordyellowin the response means the cluster is partially healthy. If you seered, investigate further.
Elasticsearch Snapshot Repository Setup (Optional)
Click to expand Elasticsearch Snapshot Repository Setup details
Note: Optional for backup and recovery. Snapshot repositories enable backup and restore capabilities but are not required for basic Elasticsearch operation.
Official Documentation: For comprehensive snapshot and restore guidance, see Elastic's snapshot and restore documentation.
Important: For single cluster with multiple nodes, path.repo must be configured in elasticsearch.yml on every node. All nodes must have access to the same backup location (shared network drive or replicated storage).
Create and Configure Backup Directory
Create a backup directory on a dedicated high-performance volume (not C:):
Copy# Use a dedicated volume for backups
mkdir X:\es-backupsGrant the Elasticsearch service account full read/write permissions:
Copy# For LocalSystem (default service account)
icacls "X:\es-backups" /grant "NT AUTHORITY\SYSTEM:(OI)(CI)F" /T
# For custom service account (replace DOMAIN\svc_elasticsearch)
# icacls "X:\es-backups" /grant "DOMAIN\svc_elasticsearch:(OI)(CI)F" /T
# Verify permissions
icacls "X:\es-backups"Configure the snapshot repository path in
elasticsearch.ymlon all nodes:Copypath.repo: ["X:/es-backups"]Restart Elasticsearch on all nodes to apply the changes:
CopyRestart-Service -Name "elasticsearch-service-x64"
Register Snapshot Repository
Open Kibana and navigate to Dev Tools (Management > Dev Tools).
Run the following command to register the repository:
CopyPUT _snapshot/my_backup
{
"type": "fs",
"settings": {
"location": "X:/es-backups",
"compress": true
}
}Note: Verify that the
locationpath matches thepath.repovalue configured inelasticsearch.yml.
Verify Snapshot Repository
In Kibana Dev Tools, run the following command:
CopyPOST _snapshot/my_backup/_verifyYou should see a response confirming the repository is valid:
Copy{
"nodes": {
"node_id": {
"name": "node_name"
}
}
}
Test Snapshot and Restore Operations
Show snapshot test commands
Create a test snapshot:
CopyPUT _snapshot/my_backup/test_snapshot_001
{
"indices": "*",
"ignore_unavailable": true,
"include_global_state": false
}Monitor snapshot progress:
CopyGET _snapshot/my_backup/test_snapshot_001/_statusList available snapshots:
CopyGET _snapshot/my_backup/_allTest restore (creates a renamed copy to avoid overwriting):
CopyPOST _snapshot/my_backup/test_snapshot_001/_restore
{
"indices": "your-index-name",
"ignore_unavailable": true,
"include_global_state": false,
"rename_pattern": "(.+)",
"rename_replacement": "restored_$1",
"include_aliases": false
}Monitor restore progress:
CopyGET _recovery?humanClean up test snapshot after verification:
CopyDELETE _snapshot/my_backup/test_snapshot_001
Creating Manual Snapshots:
To create a snapshot manually at any time, use: PUT _snapshot/my_backup/snapshot_name
Automated Backups: For automated scheduled snapshots, consider implementing Snapshot Lifecycle Management (SLM). See the official SLM documentation for details.
Multi-Cluster: Cross-Cluster Replication (CCR) (Optional)
Click to expand Cross-Cluster Replication (CCR) details
CCR replicates indices from a leader cluster to a follower cluster.
IMPORTANT: CCR requires appropriate Elastic licensing/features and configuration. Confirm your subscription/supportability before enabling.
Example: Create a Follower Index
Assume:
- Leader cluster alias:
audit-cluster(registered in Register Remote Cluster Connection) - Leader cluster name:
secondary-cluster - Leader index:
my-index-000001 - Follower cluster (primary-cluster) is where you run this command
Copy
PUT /my-index-000001-follower/_ccr/follow
{
  "remote_cluster": "audit-cluster",
  "leader_index": "my-index-000001"
}
Check follower status:
Copy
GET /my-index-000001-follower/_ccr/info
Operational Commands (Single Cluster with Multiple Nodes / Multi-Cluster)
Click to expand Operational Commands details
Verify Cluster Health (local)
Copy
GET _cluster/health?pretty
Verify Nodes
Copy
GET _cat/nodes?v
Verify Remote Clusters (CCS/CCR)
Copy
GET _remote/info
Rolling Restart (High Level)
- Stop one data node
- Wait for shard relocation / health stabilization
- Start the node
- Repeat for remaining data nodes
- Then master nodes (one at a time)